Your questions are our top concern. Over the past few weeks, we have collected the most frequently asked questions about the market and financial planning. We will be sharing our responses and research on our website. Check back often as we will be continuously adding content.
PDF Version
(Posted April 7, 2020)
1. How does the stock market today compare with March 2009?
On March 23, 2020 the S&P 500 closed at 2,237 which has been the low so far in this bear market. Since that time, we have seen a strong rally back above 2600 (+16% from the lows). At its low, the market was 34% below its all-time closing high which had been reached a mere 33 days previous. A question we hear from clients is: “How does this compare to the lows reached in March 2009?”
We thought it would be useful to compare the March 23, 2020 low with the March 9, 2009 low to compare the value on offer at each date. Jumping to the conclusion, while stocks are certainly more attractive today than they were a few weeks ago, they are nowhere near the levels of cheapness we saw in March 2009.
This chart compares a few stats from those dates.
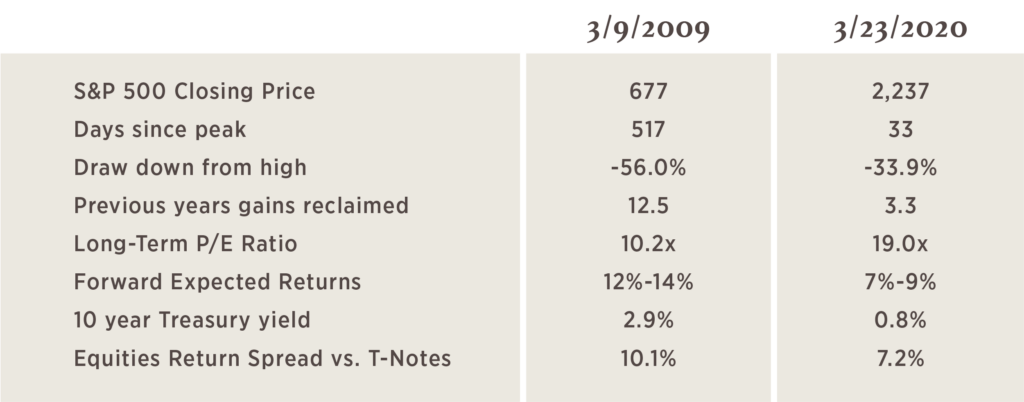
Source: Bloomberg
2. Is this a great buying opportunity?
Generational buying opportunities come about rarely (hence, generational) and they follow significant economic pain measured in multiple ways.
- Drawdown: A 34% drawdown is painful, but it is not particularly deep for a bear market. In March 2009 at the bottom, the S&P 500 was 56% off its high reached in October 2007.
- Length of time: This bear market has only been going on for a bit over a month. The shortest bear market ever was over 100 days and typically they last well over a year.
- Reclaiming previous bull market gains: The bear markets that create the best buying opportunities will take back many years of gains. The March 2009 lows not only took out the gains for the preceding 12 years it actually closed LOWER than the previous bear market low. Investors that bought the S&P 500 in March 2009 were paying the same price for the index as investors in 1997 despite the fact that the economy, as measured by GDP, was 1.7 times larger in 2009. In comparison, at the low a few weeks ago this bear market was back to levels from only 3 years ago and at current levels we are back to levels from January 2019.
- Forward expected returns: At generational lows, the forward expected returns for stocks are in the double digits. In 2009, the forward expected returns at the bottom were between 12% and 14%. Currently, we estimate the forward returns for the equity market are 7%-9%. Even with lower yields on bonds currently, the spread in expected stock returns vs. 10 year Treasury notes was significantly higher in 2009 at over 10% compared to a current spread of 7%.
What we know:
- Stocks are currently priced to deliver higher forward returns than they were six weeks ago.
- Stocks have better forward return expectations than bonds.
- Stocks are not as attractively valued as in March 2009.
- If March 23, 2020 was the low, it will be the shortest bear market in history.
- A well-diversified portfolio has seen stocks underperform bonds over the past year and the asset allocation might need to be rebalanced which would mean buying more stocks and selling bonds.
- Markets live in the future. They will anticipate the good (and bad) news quickly and the ability to trade that effectively is limited.
- Most of the economic damage to the economy is still to come.
- The Federal Reserve and the Federal government have responded with significant programs to stabilize markets and the economy.
What we don’t know:
- If the March 23, 2020 low will be the bottom of this bear market or if we will have a re-test.
- If we will get a chance to buy stocks at lower levels which compare favorably to the purchase prices available in March 2009.
- How long the economic slowdown will last or how much the economy will contract.
- What medical breakthroughs will (or will not) develop.
- If there will be re-flare ups of COVID infections in already impacted regions once social distancing is removed.
The best course of action is to stick with the well-thought-out financial plan you and your advisor have in place and continue to focus on the long-term benefits from a well-diversified portfolio.
(Posted March 23, 2020)
3. Why have municipal bonds done so poorly?
We all know the past month has been awful for equity investors but in recent days municipal bonds have also been hit hard. This is unusual since municipal bonds typically have a negative correlation to stocks, meaning they don’t move in lockstep.
Last year municipal bonds, as represented by MUB, a widely used ETF, actually had a negative correlation to the S&P 500 – -0.39 to be exact. One of the appeals of owning municipal bonds in addition to the tax free income is how well they hold up in times of equity sell-offs. For example, in Q4 2018 the S&P 500 was down 14% but municipal bonds were up 1.9%. This diversification benefit is why we encourage investors to own municipal bonds.
Unfortunately during the current market sell-off, municipal bonds have contributed to client losses instead of cushioning against them. So far in March, the S&P 500 is down nearly 25% and municipal bonds are down nearly 13%. If municipal prices stay at current levels, this will be the worst monthly returns for municipals, as measured by the Bloomberg Barclays Municipal Bond Index, since the index began in 1980.
The table below shows the worst six monthly returns for the S&P 500 since 1980 and the corresponding return for municipals during the same period. As you can see, municipals have never failed investors as much as they are currently.
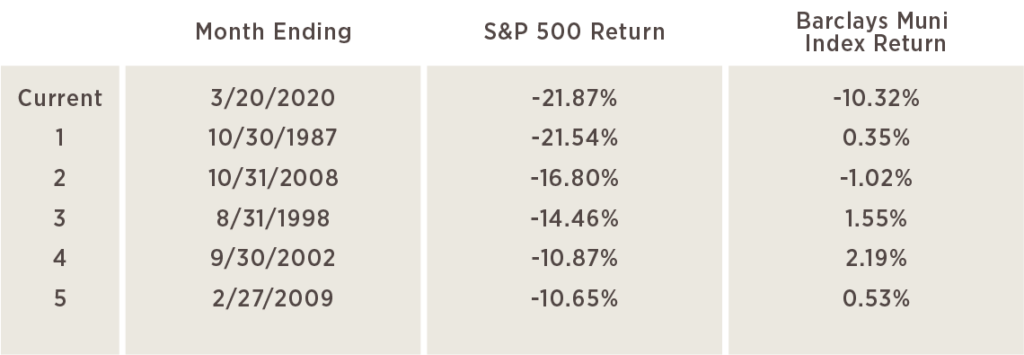
Source: Bloomberg
4. Why are municipal bonds not performing their historic role?
Since the financial crisis of 2008/2009, increased regulations have required investment banks to reduce the inventory of municipal bonds they can carry on their balance sheets. The corporate tax rate cuts in 2017 also made municipals less attractive for banks to hold. As a result, the market is less liquid.
When an asset manager needs to trade large block sizes of bonds, there are fewer dealers willing to bid for the bonds and the sizes they are willing to buy are smaller than they were 15 years ago. As a result, the prices decline more significantly when sellers need to move quickly (like when clients are redeeming from mutual funds). This morning, March 23, 2020, the Fed announced measures that will allow them to directly buy municipal bonds which should start to stabilize trading. In the meantime, new dollars committed to municipal bonds at current prices are likely to deliver 3.5%+ tax free income as shown below.
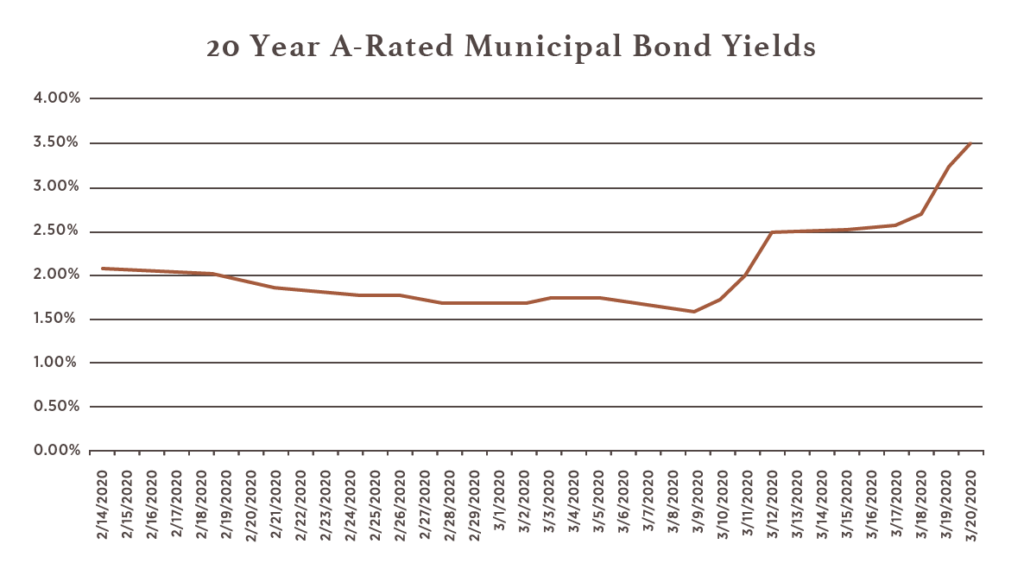
Source: Bloomberg
5. A look at beta and correlation.
Most of you have heard us talk about the beta inside your investment portfolio. Beta measures the amount of systematic risk (risk from just being invested in stocks) that resides inside your portfolio. There are many academic studies which show that over long periods of time stocks with low beta deliver more return than they should considering the amount of risk they take.
This anomaly is a key element of our portfolio construction process. We also look at the beta of other asset classes compared to equities. This helps us in constructing diversified portfolios. The table below shows the correlation and beta for five different investments for calendar year 2019 compared to the S&P 500 stock index.
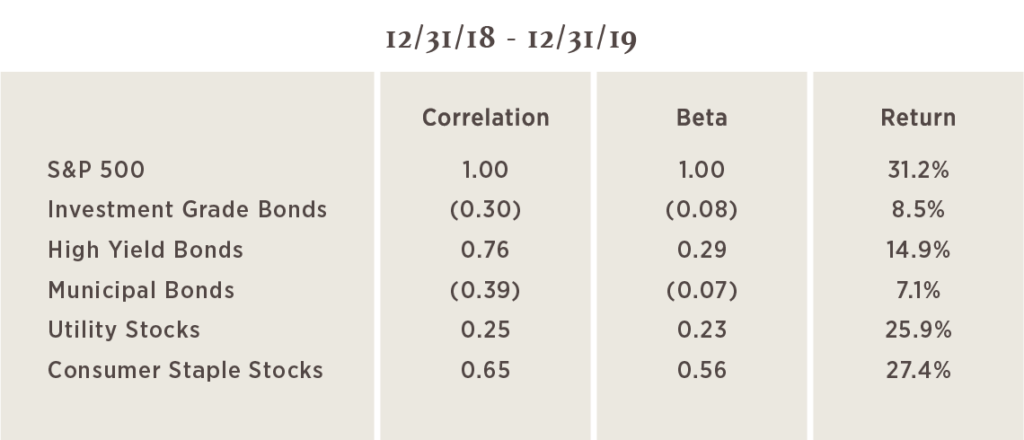
Source: Bloomberg
Each of these assets generated positive returns in 2019 but they did so independently of each other. We know this by looking at the first two columns which show the correlation and beta for each asset class. Investment grade bonds and municipal bonds actually had negative correlation and beta to the S&P 500 which suggests that they zigged when the S&P 500 zagged.
In times of market stress, we know that the correlations of assets and the resulting beta will increase. Some investors sell indiscriminately across asset classes, driving down prices all at once. The table below shows what has happened during March 2020 for the same asset classes.
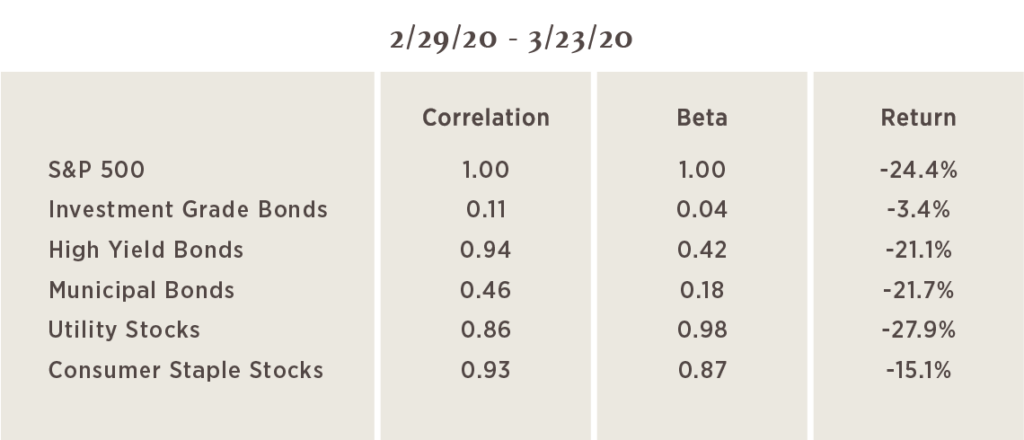
Source: Bloomberg
As you can see all of these assets are down for the month of March but what is most detrimental to investor portfolios is the increases in correlations and betas across the board. The increase in correlations for municipal bonds (discussed in our other client question today) has been particularly damaging. Municipal bonds went from being significantly negatively correlated to the S&P 500 to significantly positively correlated. For equity portfolios we manage, the increase in beta for utility stocks and consumer staple stocks has been a large detractor from performance.
For comparison, we also show the same table for October 2008. The same thing happened with correlations and betas increasing especially for high yield bonds and utility stocks.
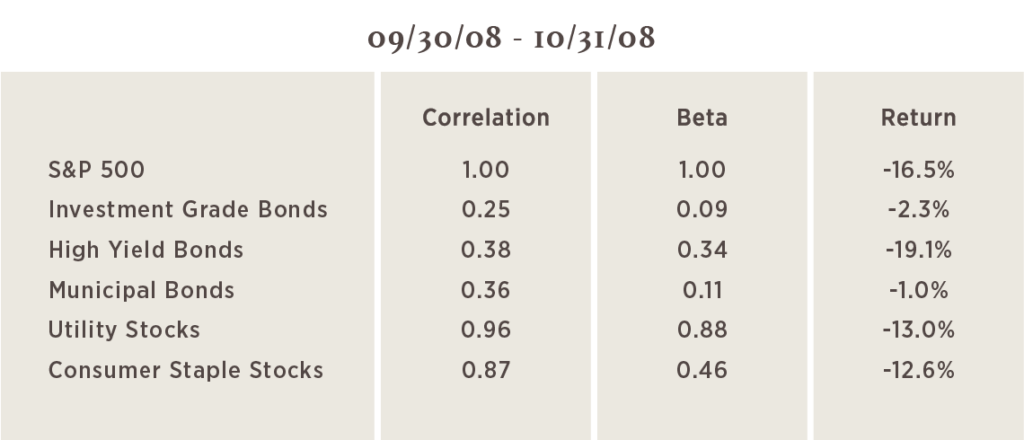
Source: Bloomberg
It will take some time, but we still believe that owning lower beta stocks over long time horizons will deliver better risk-adjusted returns to investors. This spike in correlations and betas is painful to live through but we don’t anticipate it being long lasting.
(Posted March 19, 2020)
“You make most of your money in a bear market, you just don’t realize it at the time.”- Shelby Cullom Davis
6. Are we in a bear market?
Stock markets around the globe have entered into a bear market which is defined by a 20% decline from the previous high. Earlier this week, the S&P 500 closed at 2,386 which was exactly 30% below the high on February 19th.
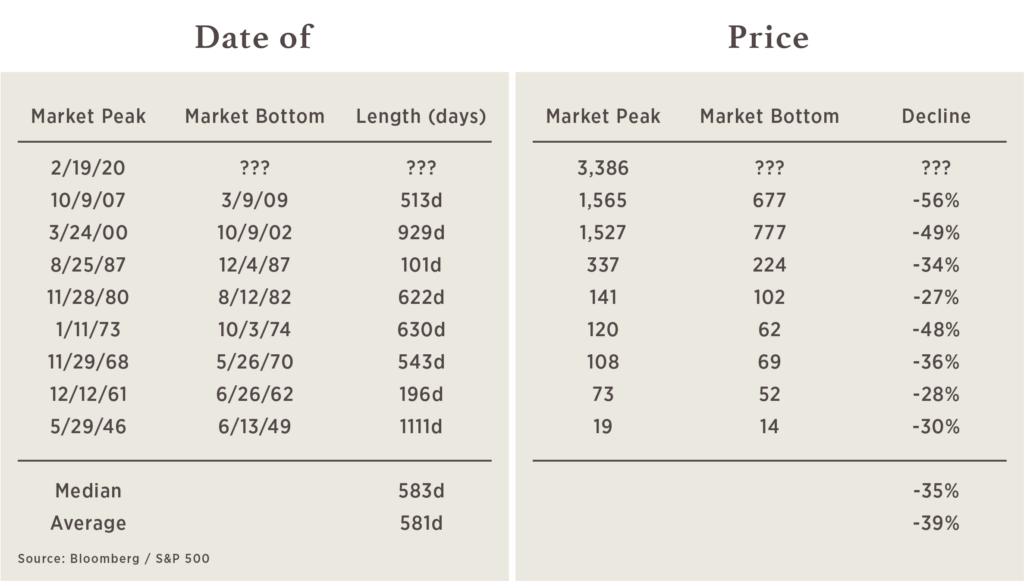
Bear markets are not that common. Since World War II the US stock market has experienced eight completed bear markets making this current bear market the ninth. Each one has different causes and most, but not all, are accompanied by an economic recession. They all do eventually end but they do considerable damage to investment portfolios and the onset of such market downturns causes significant investor concern.
The table below shows data on the previous eight bear markets to provide some context on what has happened in the past and hopefully to give you some insight into what to expect.
7. How long do bear markets last?
The shortest bear market was in 1987. It lasted just over 100 days and saw the market decline by 34%. This was a bear market that had no recession associated with it. The market became overvalued and it repriced quickly. After this short bear market, stocks rallied for the next 13 years before the Tech Bubble.
The longest bear market was after World War II ended. It lasted 1,111 days but the market only declined 30% in total over those three years. In the table we show the average and median lengths of time that bear markets last. Both are approximately 580 days. If this bear market was average then we would not expect it to end until sometime in 2021. This doesn’t mean the market is going to go down every day for the next year and a half. The market is likely to have periods where it goes up (possibly significantly) but history tells us the final bottom is likely not coming for many months. You might be asking yourself, “If the market is going down for the next 18 months why don’t I just sell now?”.
We don’t recommend selling now for many reasons:
- The majority of the damage to your portfolio is likely already done.
- If you do sell now, you are locking in your losses unless you buy back in at the same or lower prices sometime in the future. How will you know when to buy back in? If you wait until the skies are clear and you feel more confident it will be too late. They don’t ring a bell at the top and they certainly don’t ring a bell at the bottom.
- The market is likely to have some very strong rallies over the next several months and perhaps that would be a better time to reduce your allocation to stocks.
- The investments you own are likely still producing strong dividend payments which can be either reinvested or used for expenses.
- You and your advisor have laid out a long-term plan which is likely to be still correct for you unless your situation has changed.
8. How much could I possibly lose?
The smallest decline in the history of bear markets was 27% in the early 1980s. With the market down 30% we know that we are going to be worse than that. The largest decline was the financial crisis when the market lost 56% from its peak in October 2007 to its bottom in March 2009. The average decline for bear markets is 39% and the median is 35%. Based on where we sit today, if this was a typical bear market then the majority of the losses have been realized but there is always the chance that it could be worse than normal.
What we know:
- The market is likely to go lower from here
- This bear market will last for many more months (with rallies along the way)
- Most of the damage is probably already done to equity portfolios (unless we get a historically bad bear market)
What we don’t know:
- How much more it will go down – based on previous bear markets, there shouldn’t be a lot more downside from here but there are a few cases where it could get much worse
- How long this will last – we try to avoid forecasts about when or how much since it is unknowable but we do believe the low could be sometime in 2020
(Posted March 18, 2020)
9. Do I have too much risk inside my portfolio? Is now the time to rebalance?
One month ago (Feb 17, 2020) the global markets were calm and near all-time highs. Since then we have seen a violent bear market (fastest in history) cause large losses for investors in stocks. At this time, many investors are wondering if they have the right allocation or if they need to reduce risk. Unfortunately, the bear market has done some de-risking for you. How?
Here is a simple table that shows how a hypothetical investor’s asset allocation has changed over the past month due simply to movements in the market.
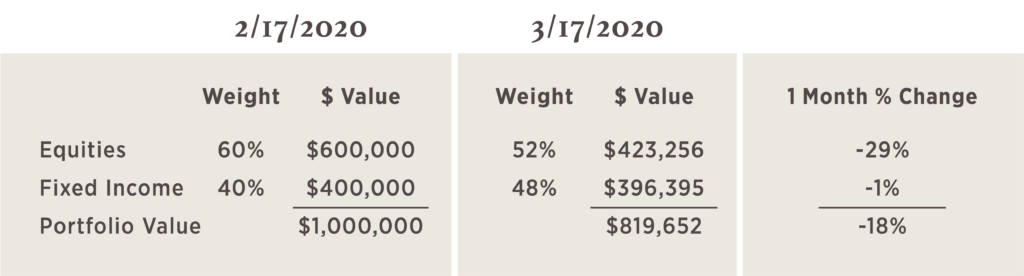
This analysis assumes a portfolio that was perfectly balanced 60% equities / 40% fixed income on February 17, 2020. One month later, the allocation of the portfolio has changed significantly solely due to the change in prices for stocks and bonds. The portfolio is now down to a 52% weight in stocks and a 48% weight in bonds. The portfolio has de-risked simply by allowing the weighting in stocks to decline. The decision for investors now is when should portfolios be re-allocated to target long-term equity allocations. Our suggestion is that should start now but should be done slowly.
10. I should have known to sell stocks in February.
All investors experience regret. In December 2019 most investors regretted not owning more US stocks. In March 2020, we all regret owning any stocks. None of us can predict the future but we nonetheless spend considerable time lamenting decisions we did or didn’t make. Many investors are currently wishing they would have sold some of their stock positions earlier this year. This may have helped psychologically, but would it have meaningfully helped the financial outcomes?
Here is a table that shows what the current situation would look like for an investor that did reduce equity exposure in February (right at the peak) and shifted their portfolio to a 50% equities / 50% fixed income allocation.
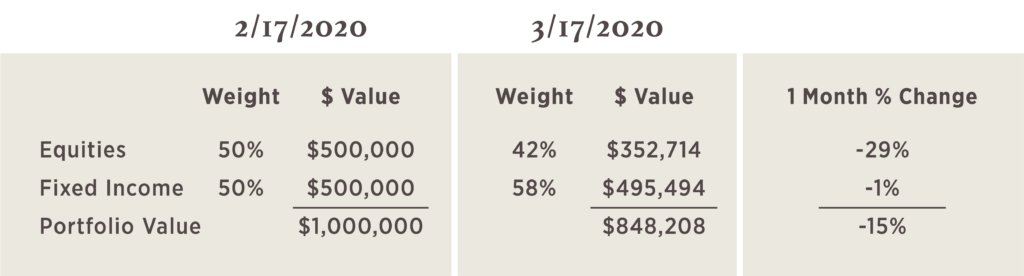
How much less pain would that investor be experiencing? Not much. Instead of being down 18% this investor would be down 15%. Obviously this is better but it is still a large drawdown.
Unless you were willing to sell a large portion of your highly appreciated stock portfolio (and pay the taxes) in February, it is difficult to see how you could have greatly reduced the drawdown. To meaningfully reduce the pain we are all feeling would require an investor to sell down over half the stock portfolio at a time when it appeared the economy was on solid footing. Absent an accurate crystal ball, we think that is highly improbable.