Breaking Down 2020 Performance
What type of characteristics do you like to see when choosing stocks to invest in? Broadly speaking, we prefer stocks that have strong balance sheets, high profitability, relatively low volatility, and are priced inexpensively. We also prefer to take a diversified approach rather than concentrating too heavily in a single name or industry. In 2020, each part of that approach managed to work against investors at some point. Here are three observations about the environment we faced:
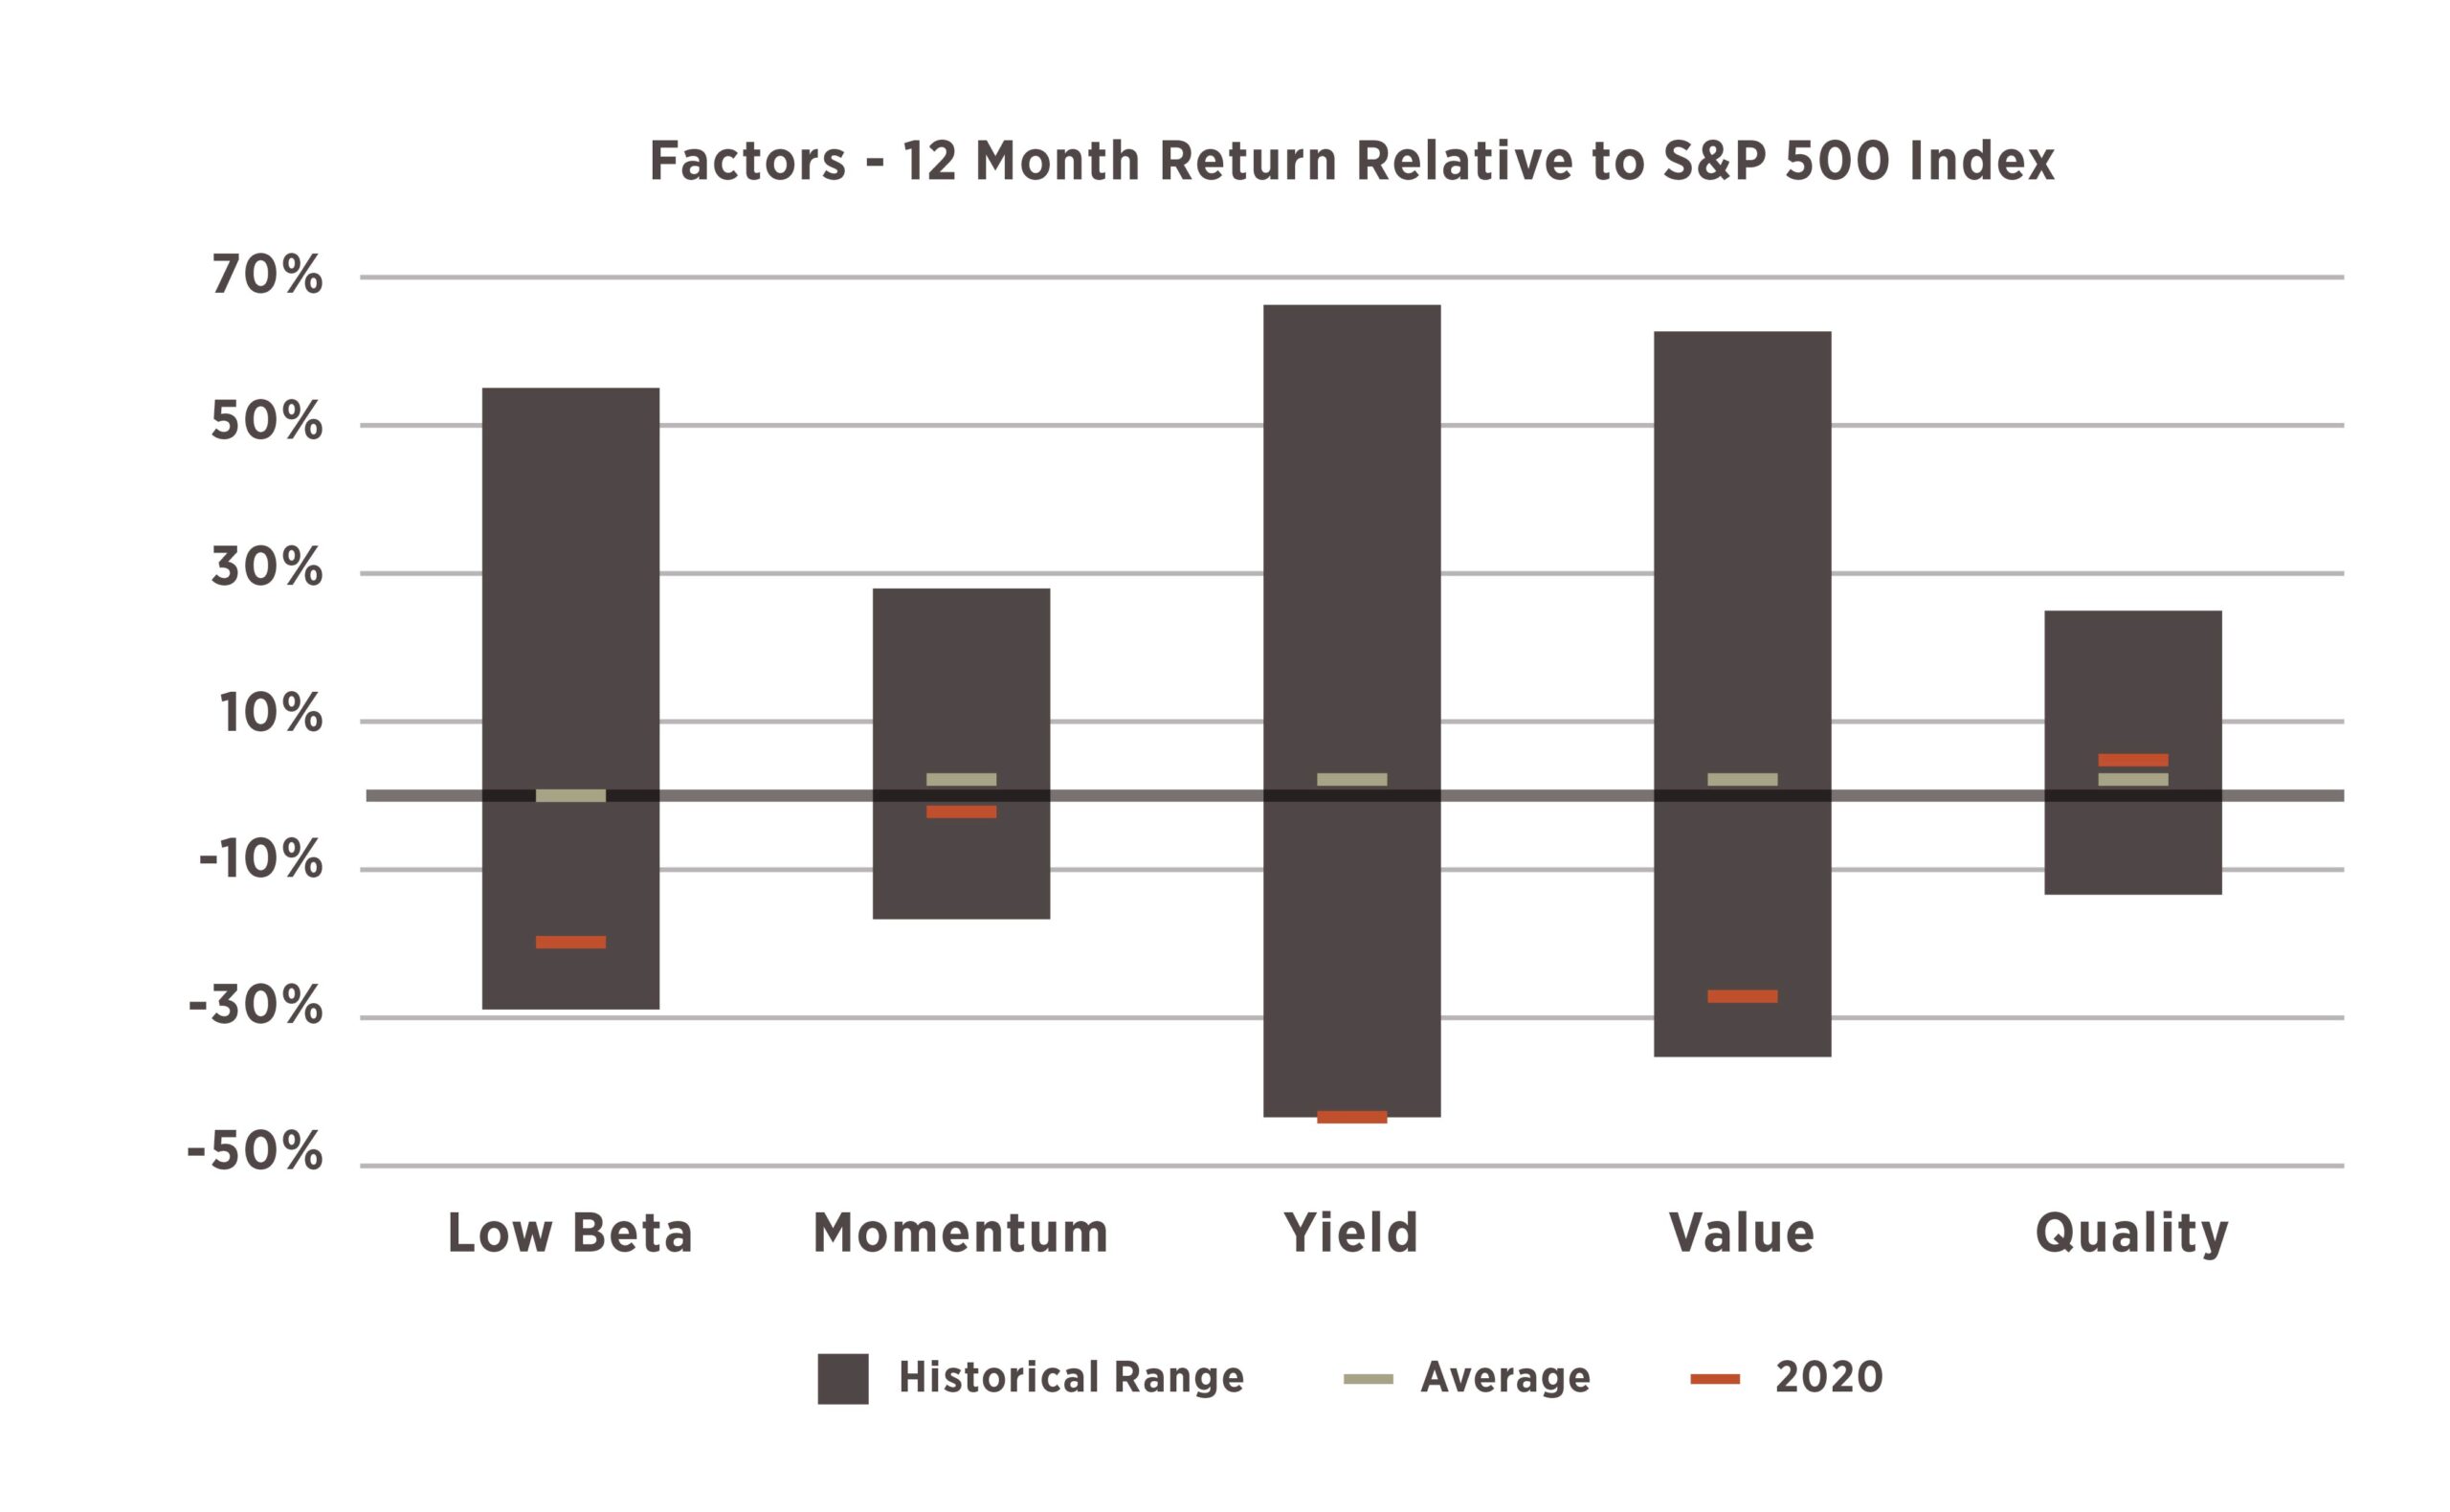
- One of the worst years ever for three of our key factors. High dividend stocks have never underperformed the market more significantly. Low beta and value have only been worse during the dotcom bubble. For each of these strategies this performance is in the sub-5th percentile – meaning that 95% of the time during history they have performed better vs. the S&P 500.
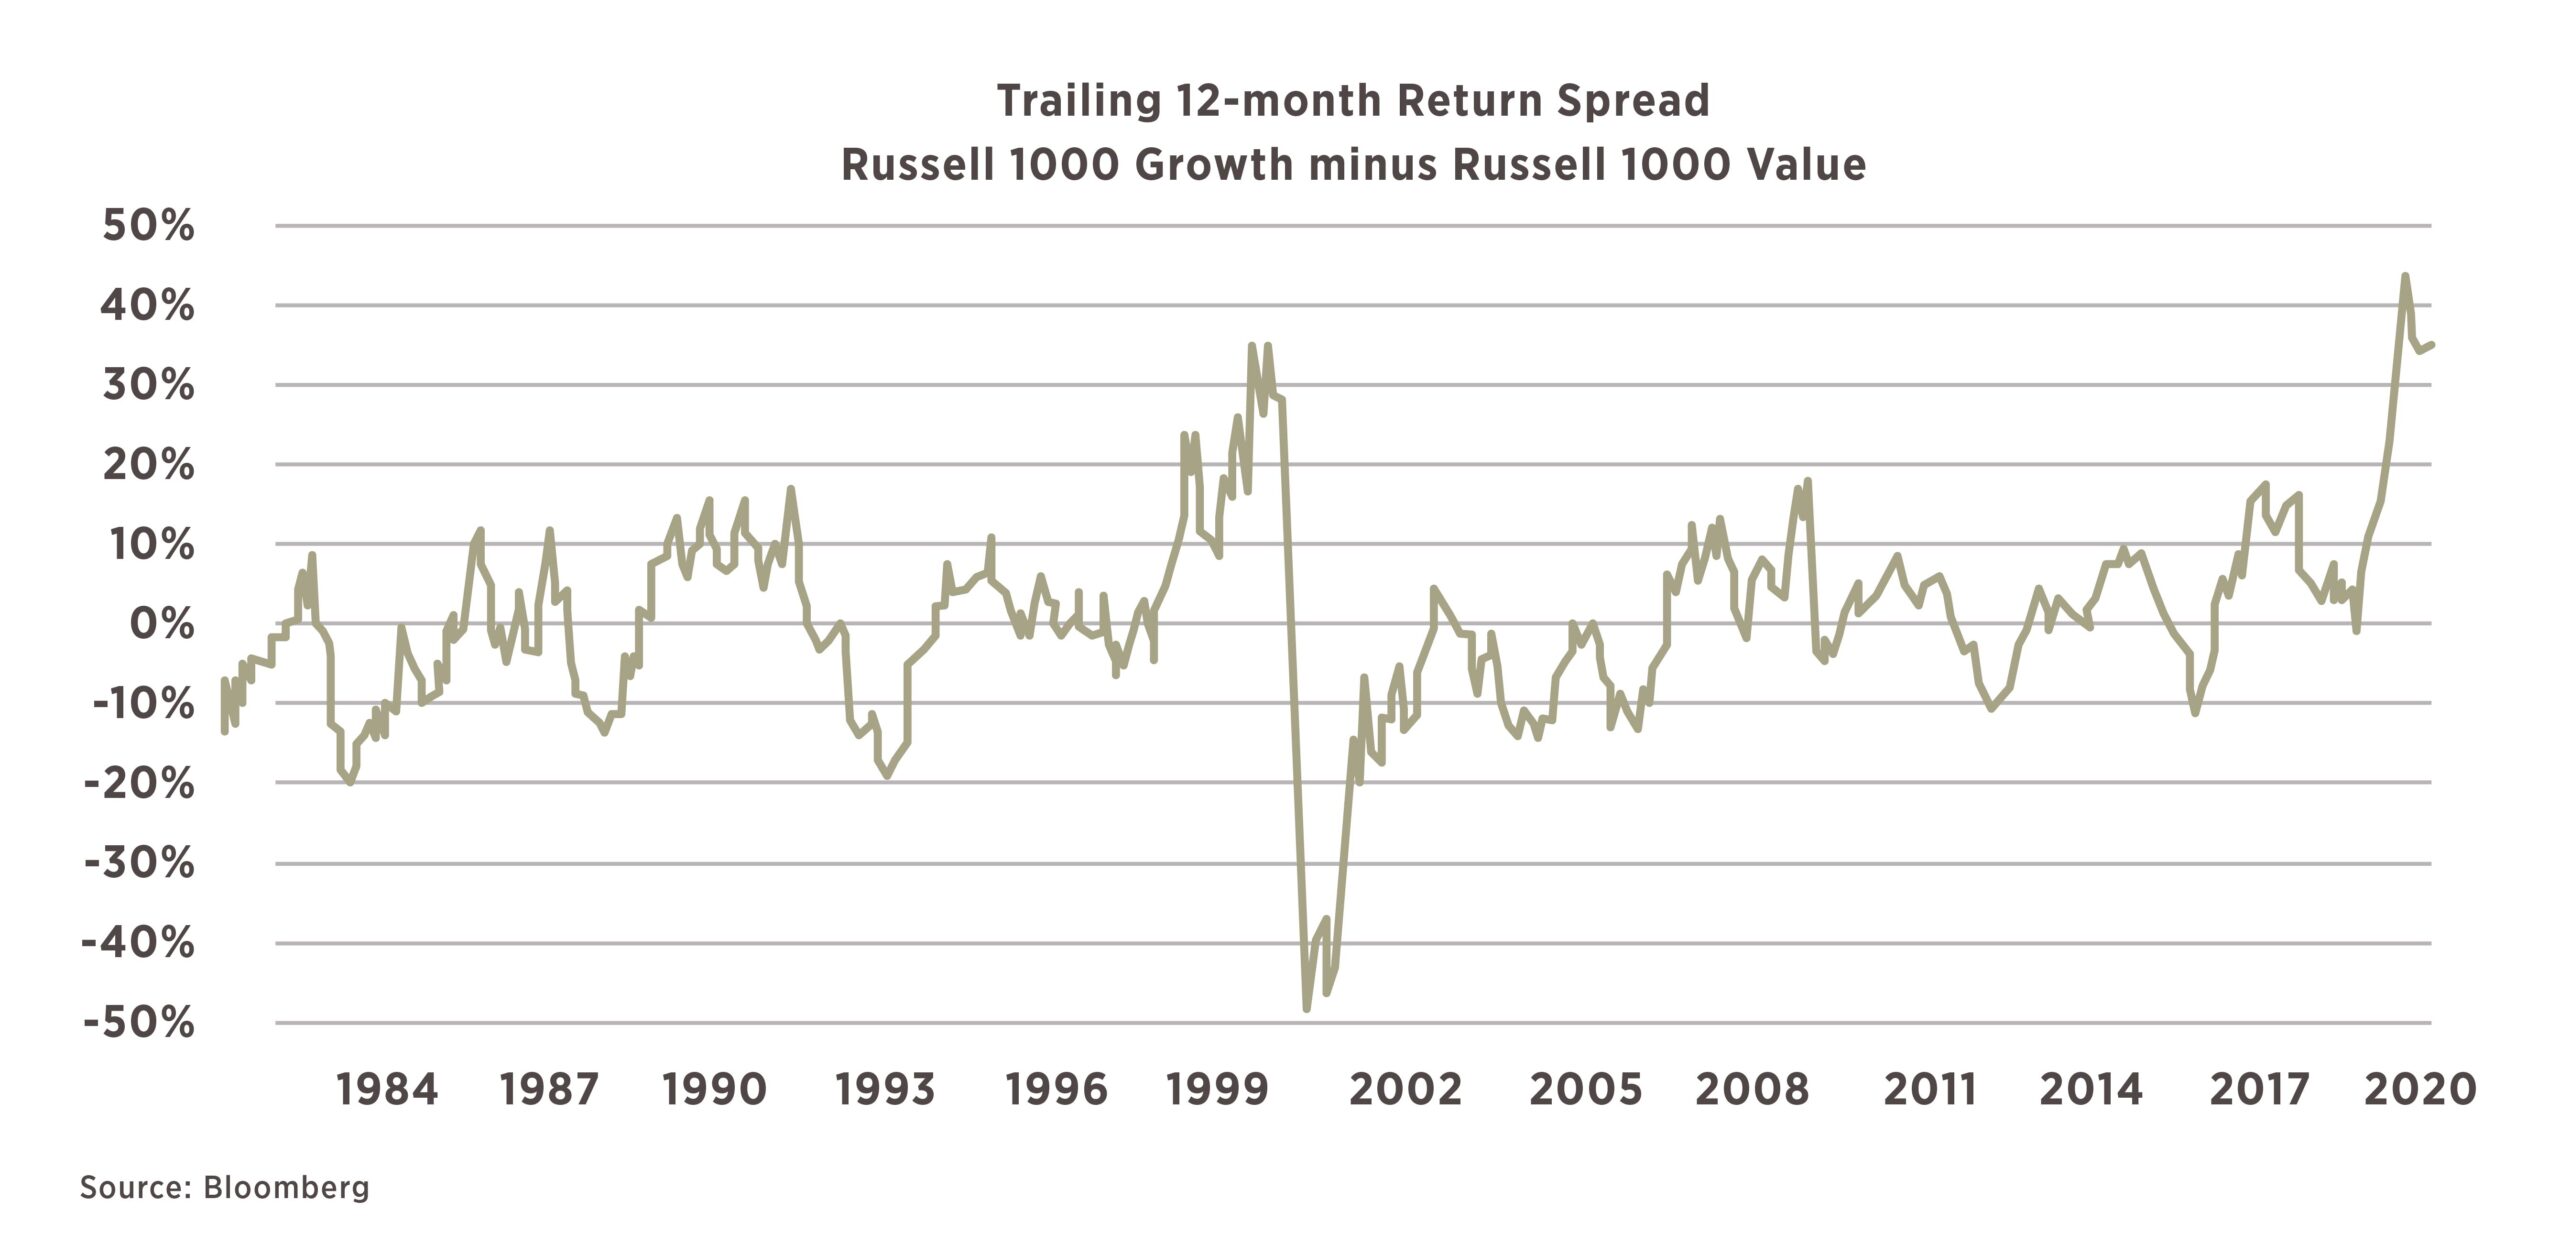
- Growth trampled value. Our portfolios are not dedicated value strategies, but they do have a value tilt. As mentioned above, value underperformed the S&P 500 by a significant margin. Interestingly, value’s underperformance vs. growth was the largest ever, including the dotcom bubble.
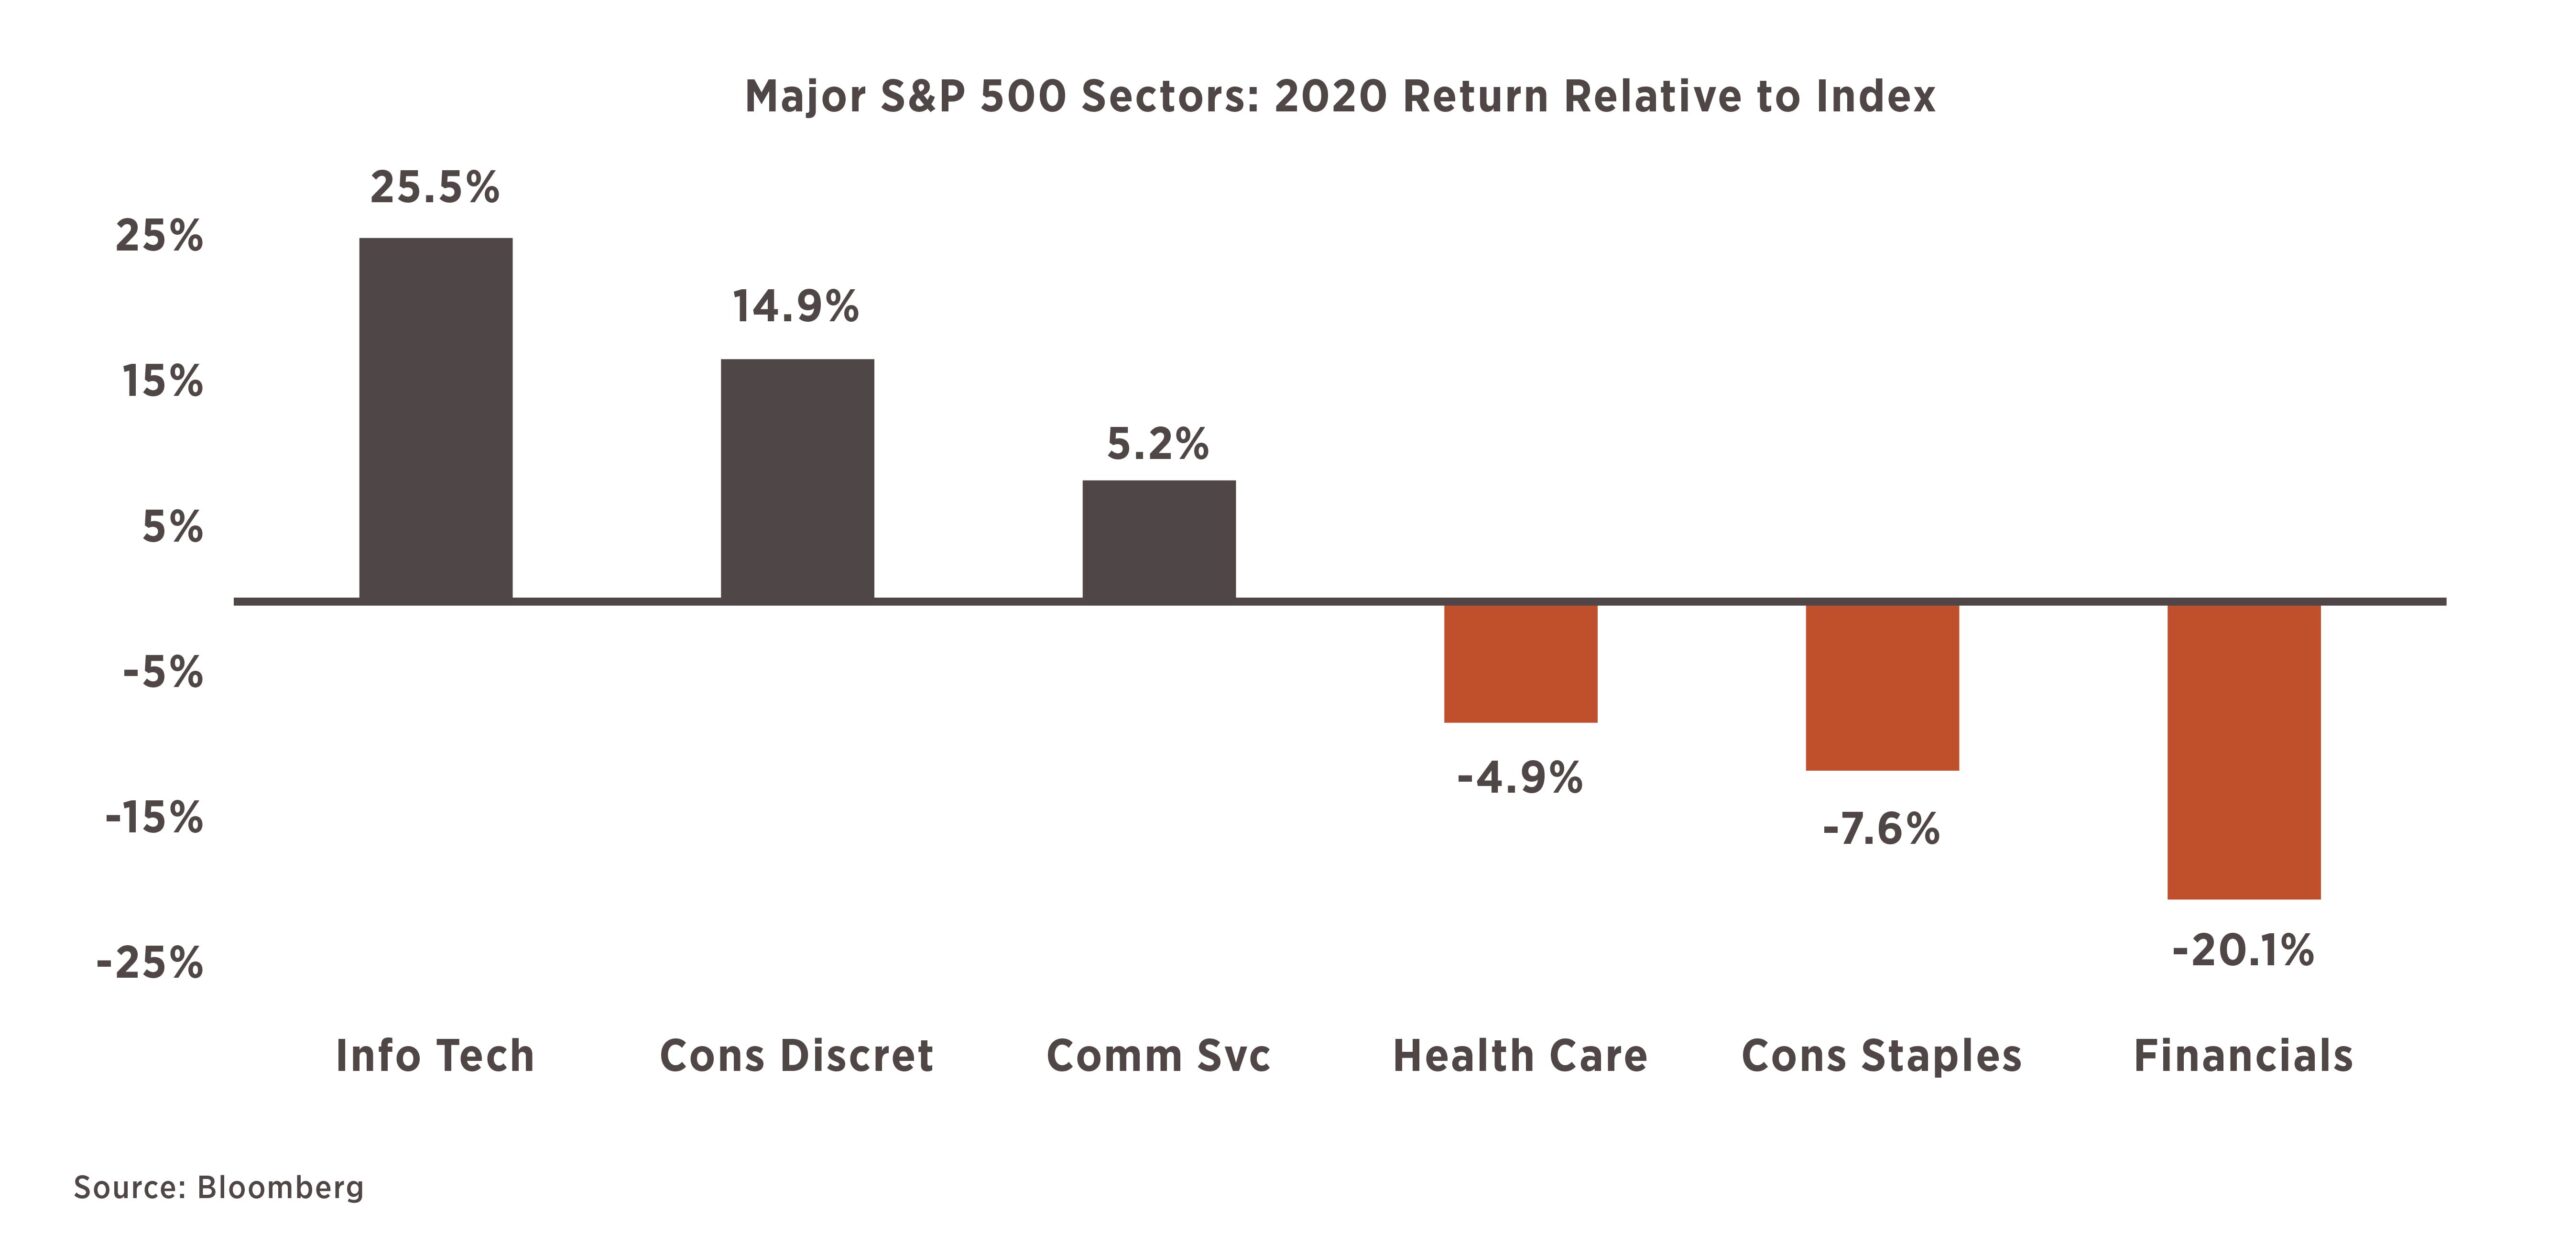
- Sector concentration. In 2020 owning tech and tech related stocks was the primary way to make money. While our portfolios did own most of the top stocks, we didn’t own them in nearly the size as the indices.
We take a look at each one as it pertains to our investment strategy:
- Factor Relative Performance: We use a combination of factors when selecting stocks for our portfolios with the goal that strength in one might offset weakness in another. In 2020, three of the five factors we use heavily underperformed the S&P 500 at a near-record scale. Low beta underperformed by 19%, high dividend yield underperformed by 42%, and value underperformed by 34%. Over our period of back-tested data since 1990, this marked the third worst year for low beta (eclipsed only by 1998 and 1999), and the absolute worst year for yield:

- Value: While we don’t run any pure value portfolios, we do use valuation as a factor when selecting stocks. As seen below, 2020 included the worst 12 months in history for value at the index level. Even with the slight reversion we saw in November, the trailing 12-month return difference between growth and value, at 36%, is worse than any point prior to 2020 including the peak of the tech bubble in 1999:
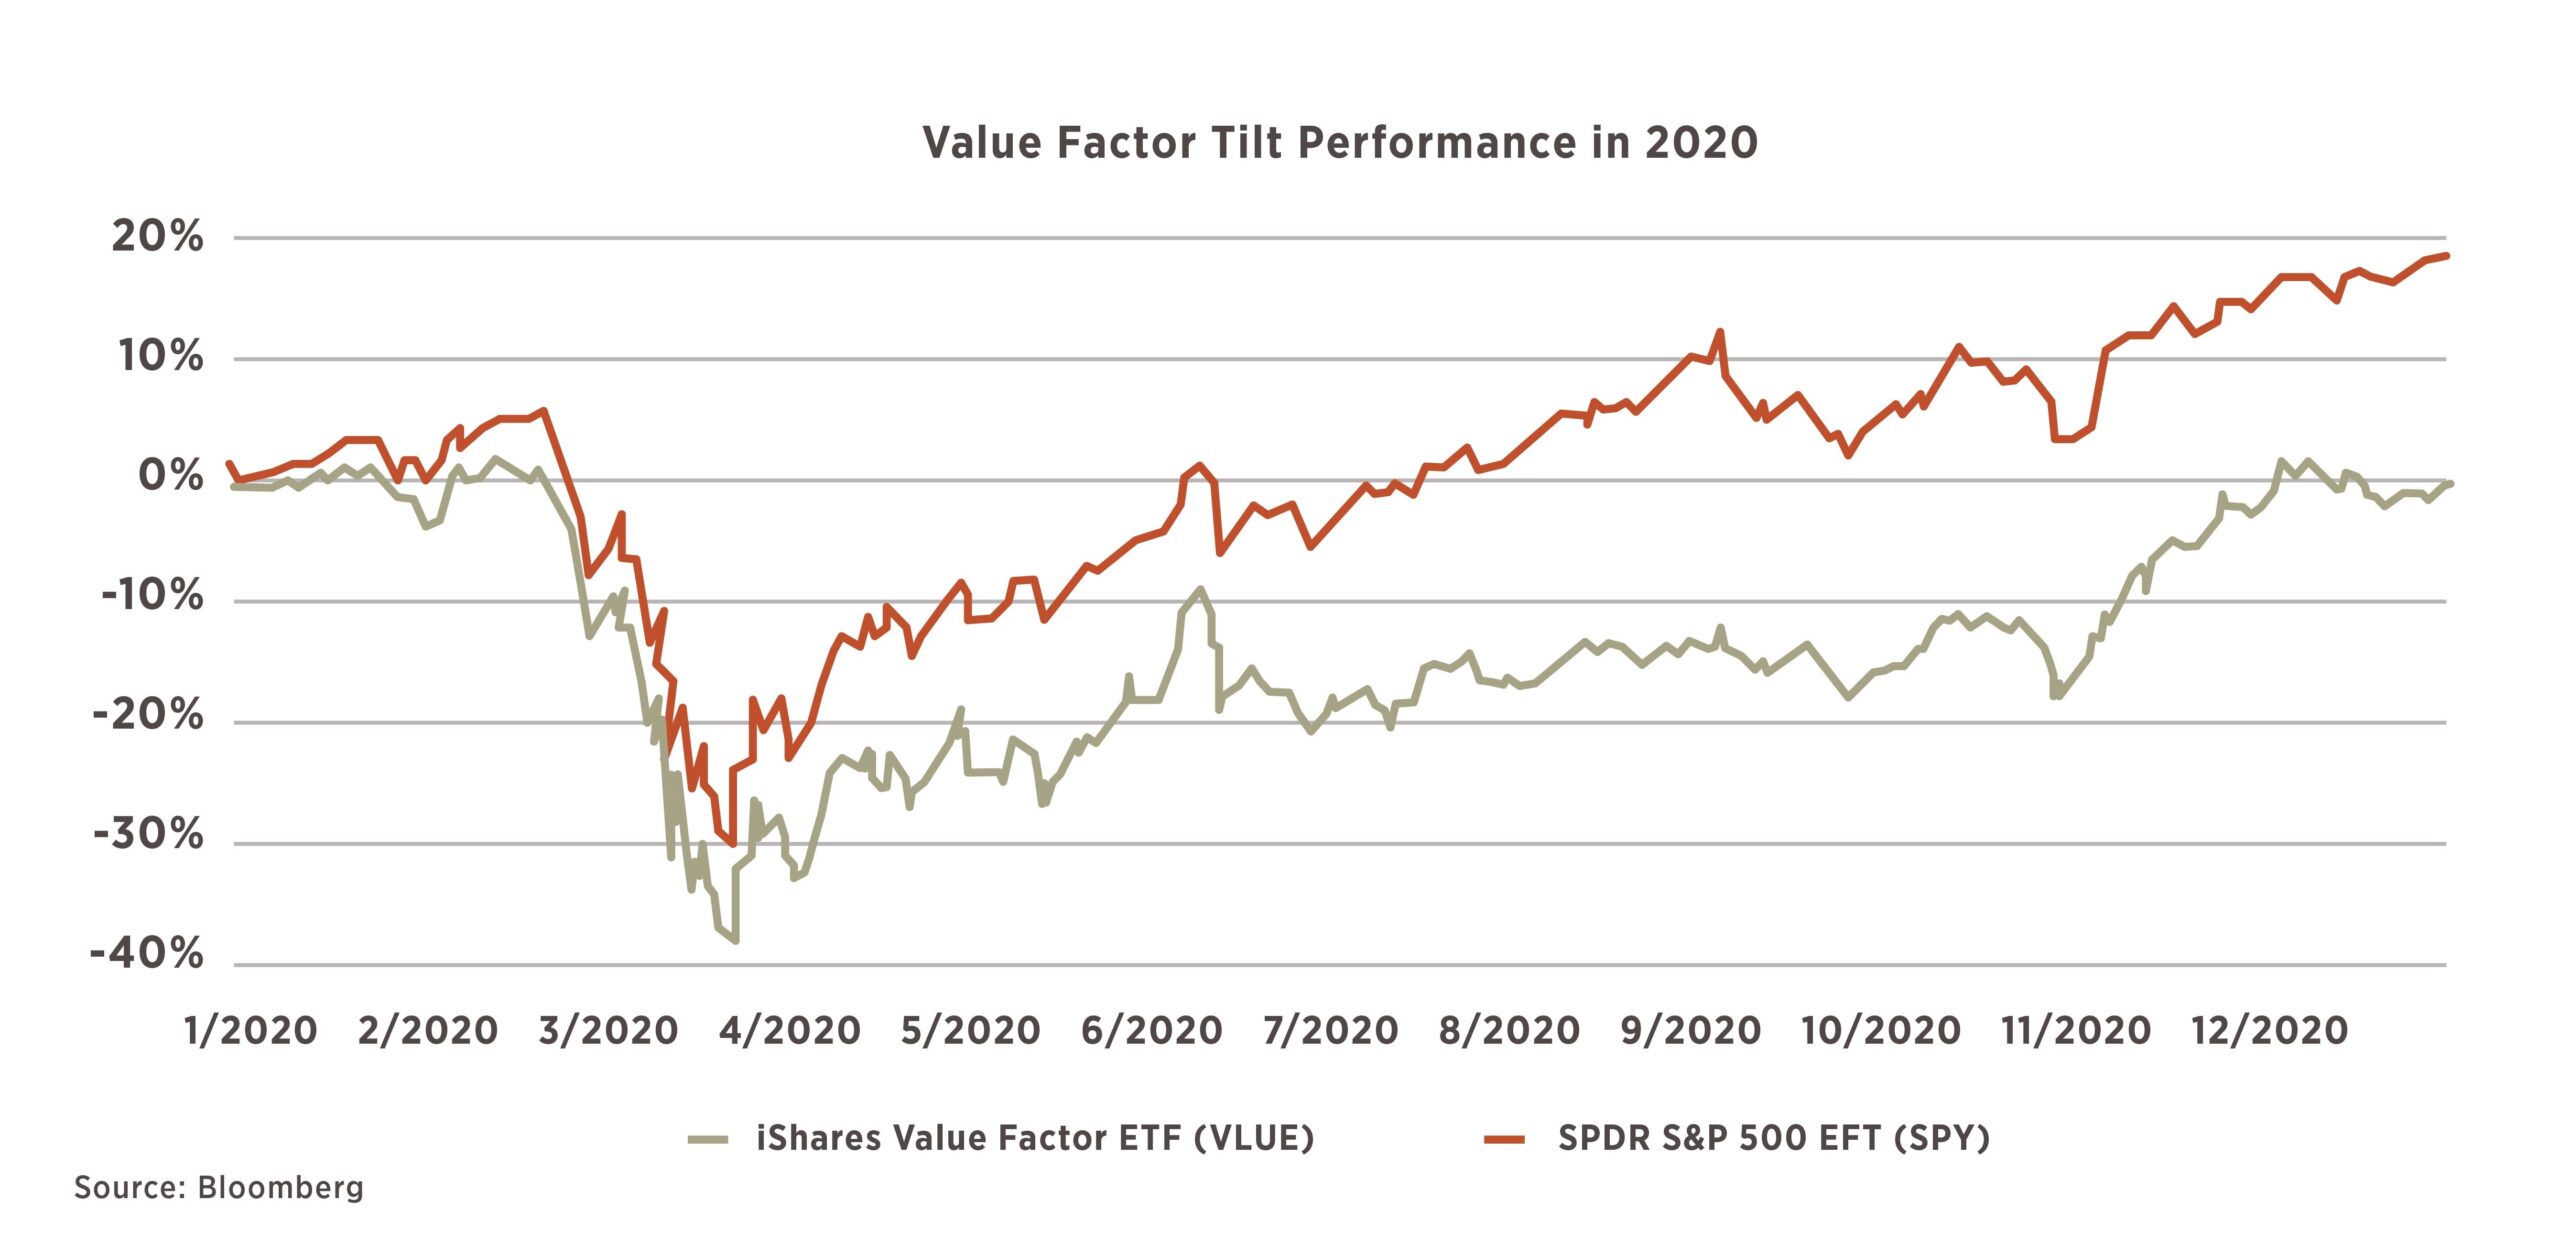
A popular iShares ETF representing value as a factor tilt – VLUE – posted a negative return for the year, lagging the S&P 500 by 19%. Most of the performance differential occurred after the market trough in March:
- Sector Performance: In 2020, a disproportionate amount of the returns within the S&P 500 index came from stocks in the information technology sector. The sector outperformed the index by a staggering 25.5%, which is even more impressive when considering that those stocks make up over a quarter of the index itself. It also means that an investor who was underweight tech was likely to underperform, especially if it meant allocating relatively more to sectors such as health care, consumer staples, and financials, which underperformed the index:
