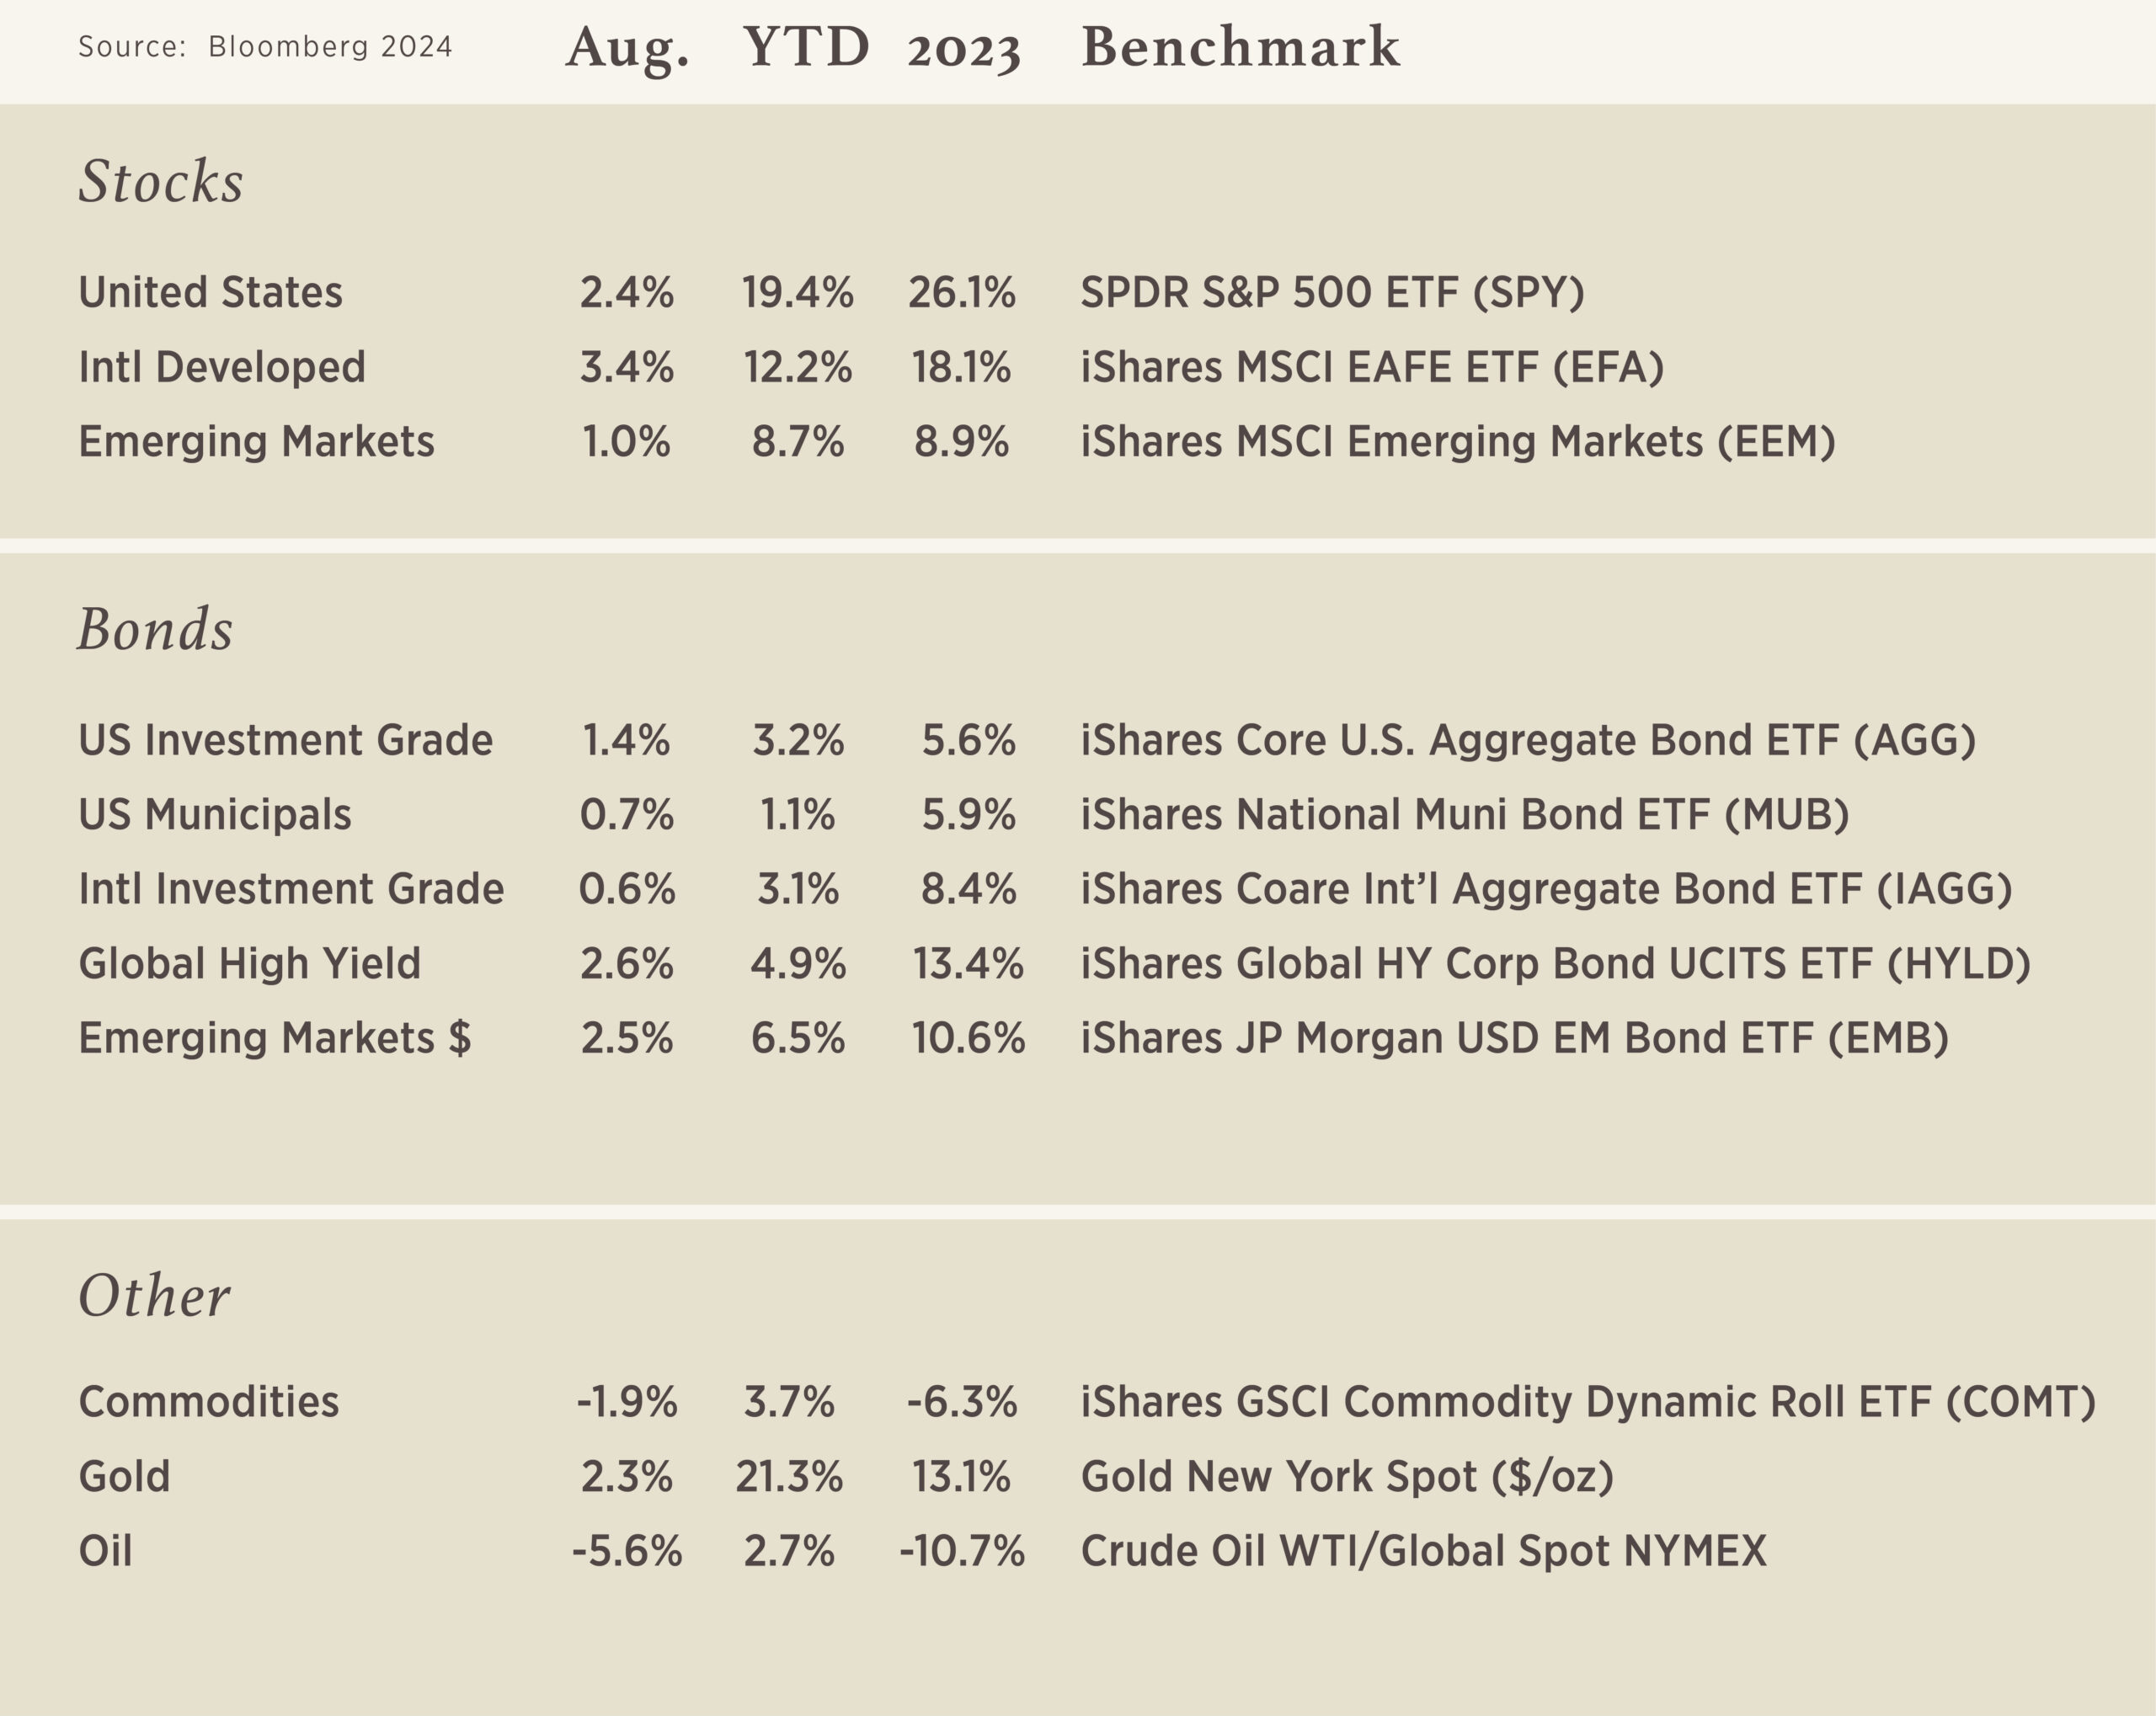
Chart of the Month
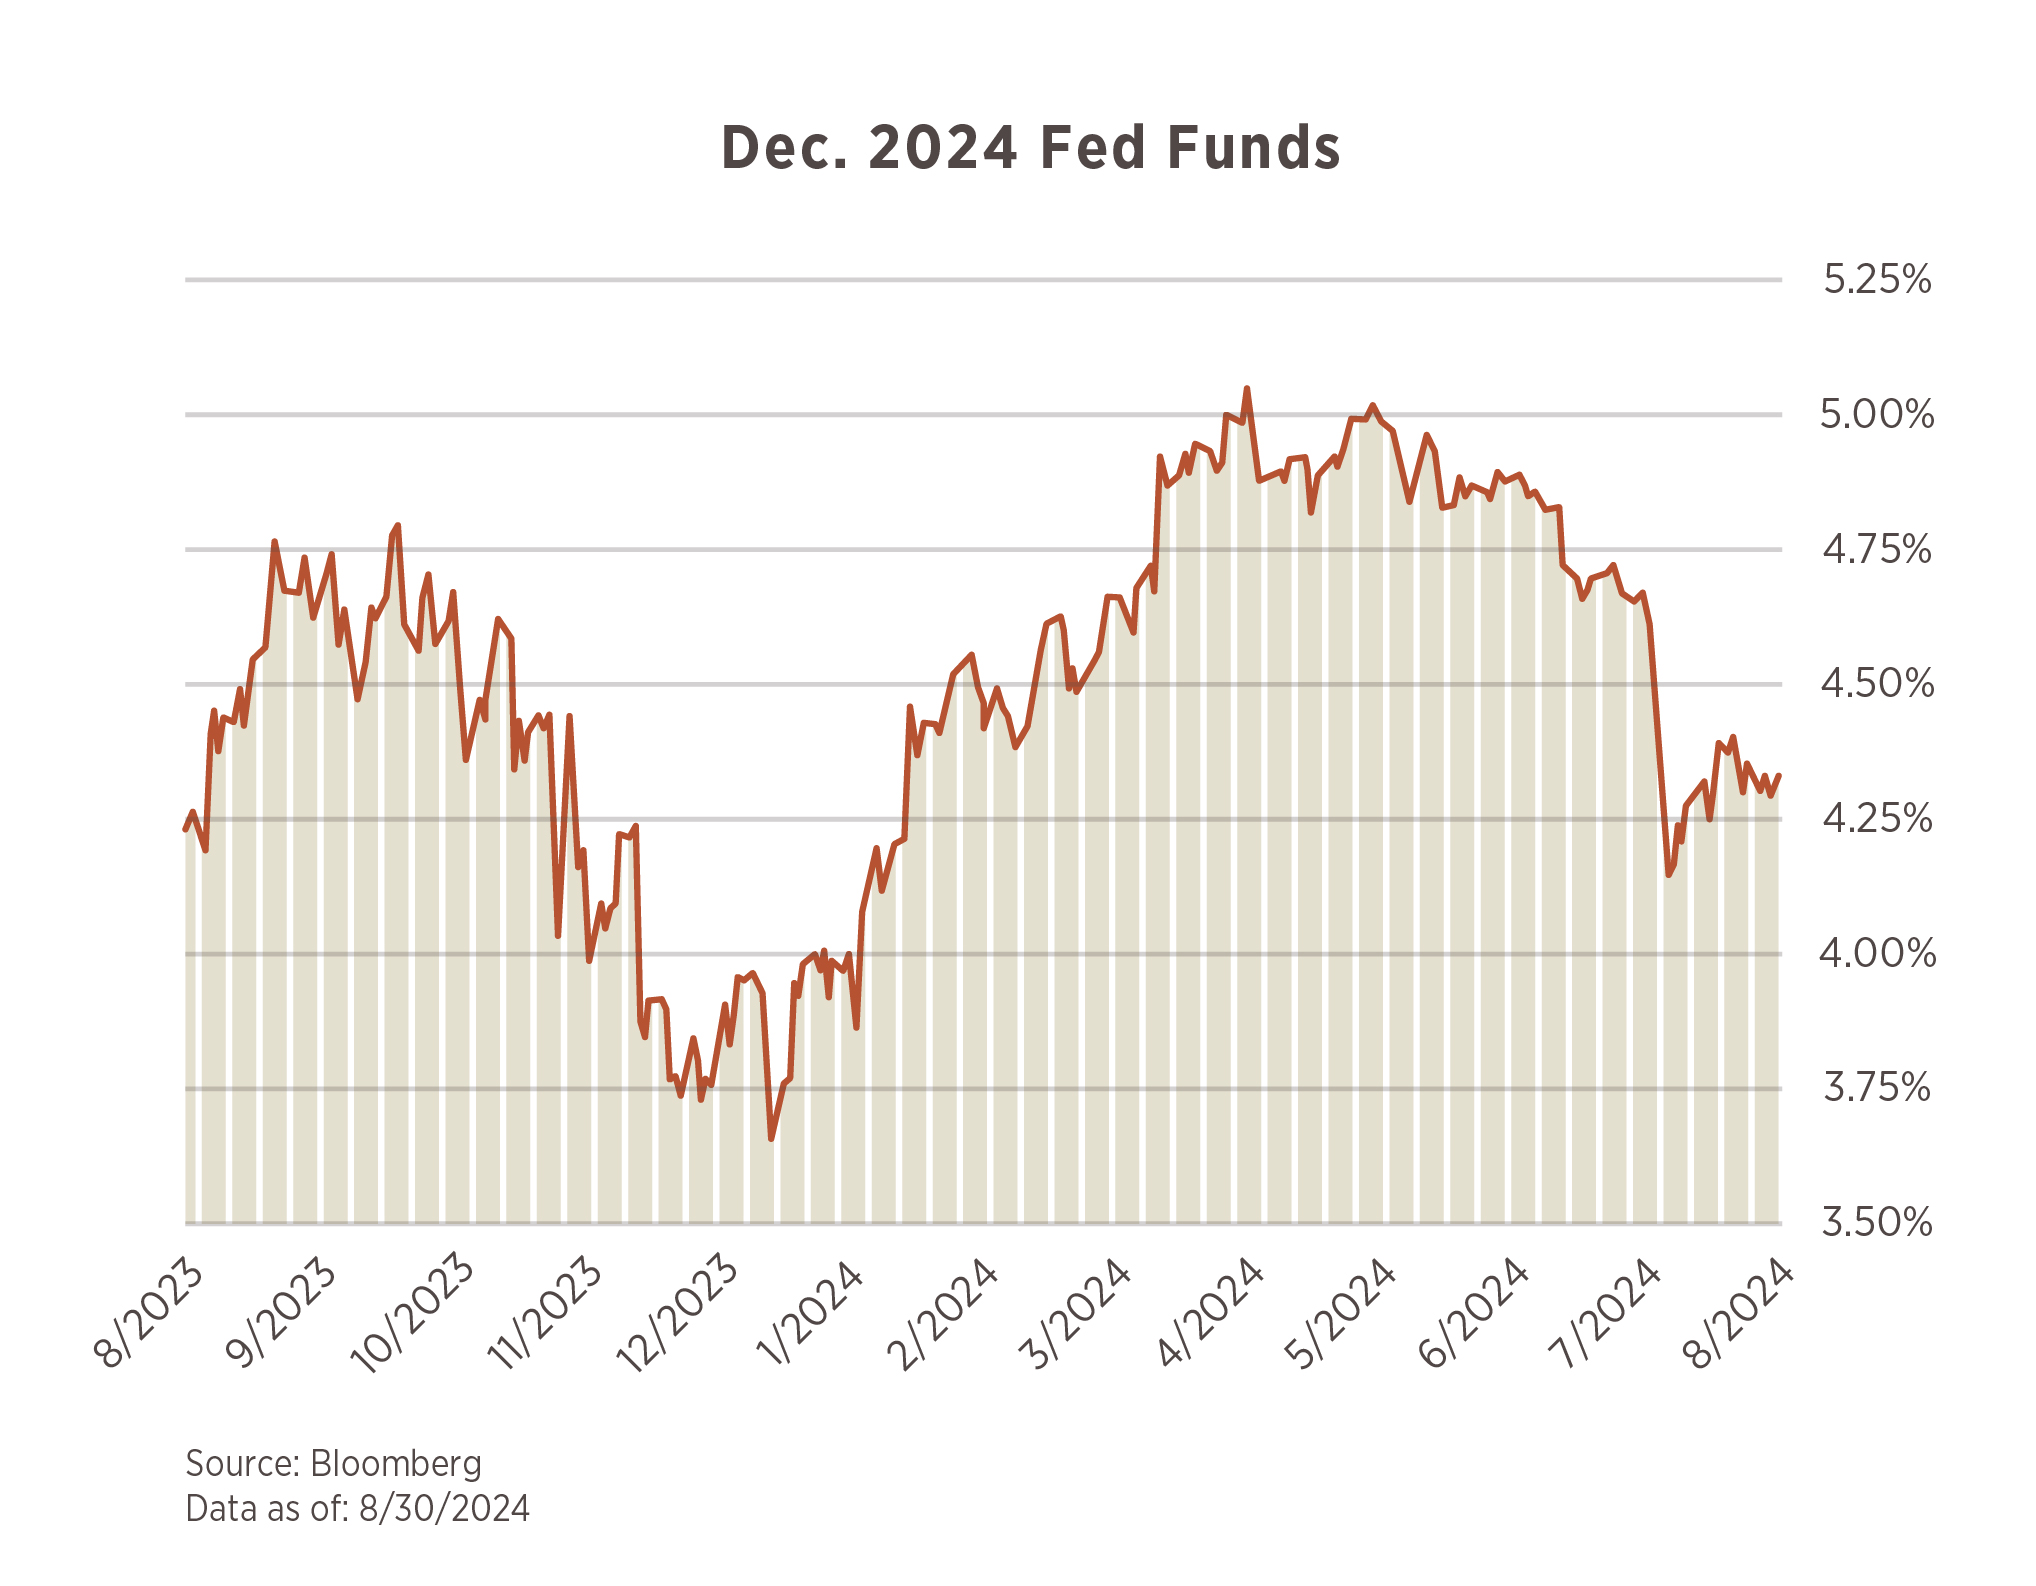
The Jackson Hole Economic Symposium has become one of the most highly anticipated economic events, especially over the past 3 years. Why? Well, aside from the wonderful backdrop of the Grand Teton Mountains, we’ve come to expect a message from one of the most important people in economics, the chairman of the Federal Reserve. Jerome Powell delivered his message to the markets on August 23 this year and, for the first time since the rate hiking cycle began, he stated: “The time has come for policy to adjust.”
Our chart this month illustrates what the market has expected the Fed Funds Rate to be by the end of 2024 (4.3%; current Fed Funds is 5.5%). Coincidentally, it has some resemblance to the Grand Tetons! To summarize it briefly:
- The market got well ahead of itself at the end of 2023, expecting as many as 6-7 rate cuts.
- The ensuing climb was the effect of “warm” inflation data and continued labor market strength early in 2024.
- Most recently, both the inflation data and labor data has started to cool down, hence the more near-term decline over the past 1-2 months. The fact that the recent economic data has started to “cool” is what prompted Powell to make his statement at Jackson Hole.
All said, while the pace and magnitude at which rates are cut remains an open question for the markets to solve, the path in which the Fed will take is clearer than it has been in the last 12 months. The knock-on effect of these moves will have implications for investors in short-term, low-risk investments, as it brings into the equation reinvestment risk. The risk that when you get your money back from CDs or T-Bills, those dollars will have to be reinvested at a lower prevailing rate.


Leave Your Political Opinions at the Polls
Many people often feel uneasy about investing during election years. Soundbites from debates and polls fill the airwaves making it difficult to decipher what may or may not impact the markets. This uncertainty tends to drive heightened emotions and biases for investors. As always, it is important to work with your financial advisor to ensure your investment plan aligns with your objectives and risk appetite. During periods of uncertainty, old adages ring true evermore, and investors are programed to often forget:

It is important to recognize potential biases that may lead to sub-optimal decision making. These biases are particularly common during election years:
- HERDING: Being influenced by peers to follow trends.
- Often results in buying high and selling low (as opposed to the alternative and preferred scenario).
- CONFIRMATION: Looking for confirmatory beliefs.
- Too much news! News headlines are “scary” and emotionally driven. Be aware. Try to detach the emotions from your investment plan.
- OVERCONFIDENCE: Overestimating skill and accuracy.
- Elections are unpredictable and should not impact your investment plan.
- LOSS AVERSION: Disliking losses more than liking gains.
- When investing, it is possible to incur loss, however, there is no higher probability of loss during election years than during non-election years.
Historical data shows that it is much more impactful to stay invested than to try and time the markets. Below are four takeaways for investing in election years:
01 | Stocks Tend To Rise, Regardless of Which Party Holds Office
Since 1933, there have been eight Democratic presidents, seven Republican presidents, 14 different recessions and a number of economic downturns. One thing has held true over this 90-year time period: the stock market appreciates over the long run. A $1,000 investment in the S&P 500 on the date of Franklin D. Roosevelt’s inauguration, March 4, 1933, would have been worth over $21 million at the end of 2023.1
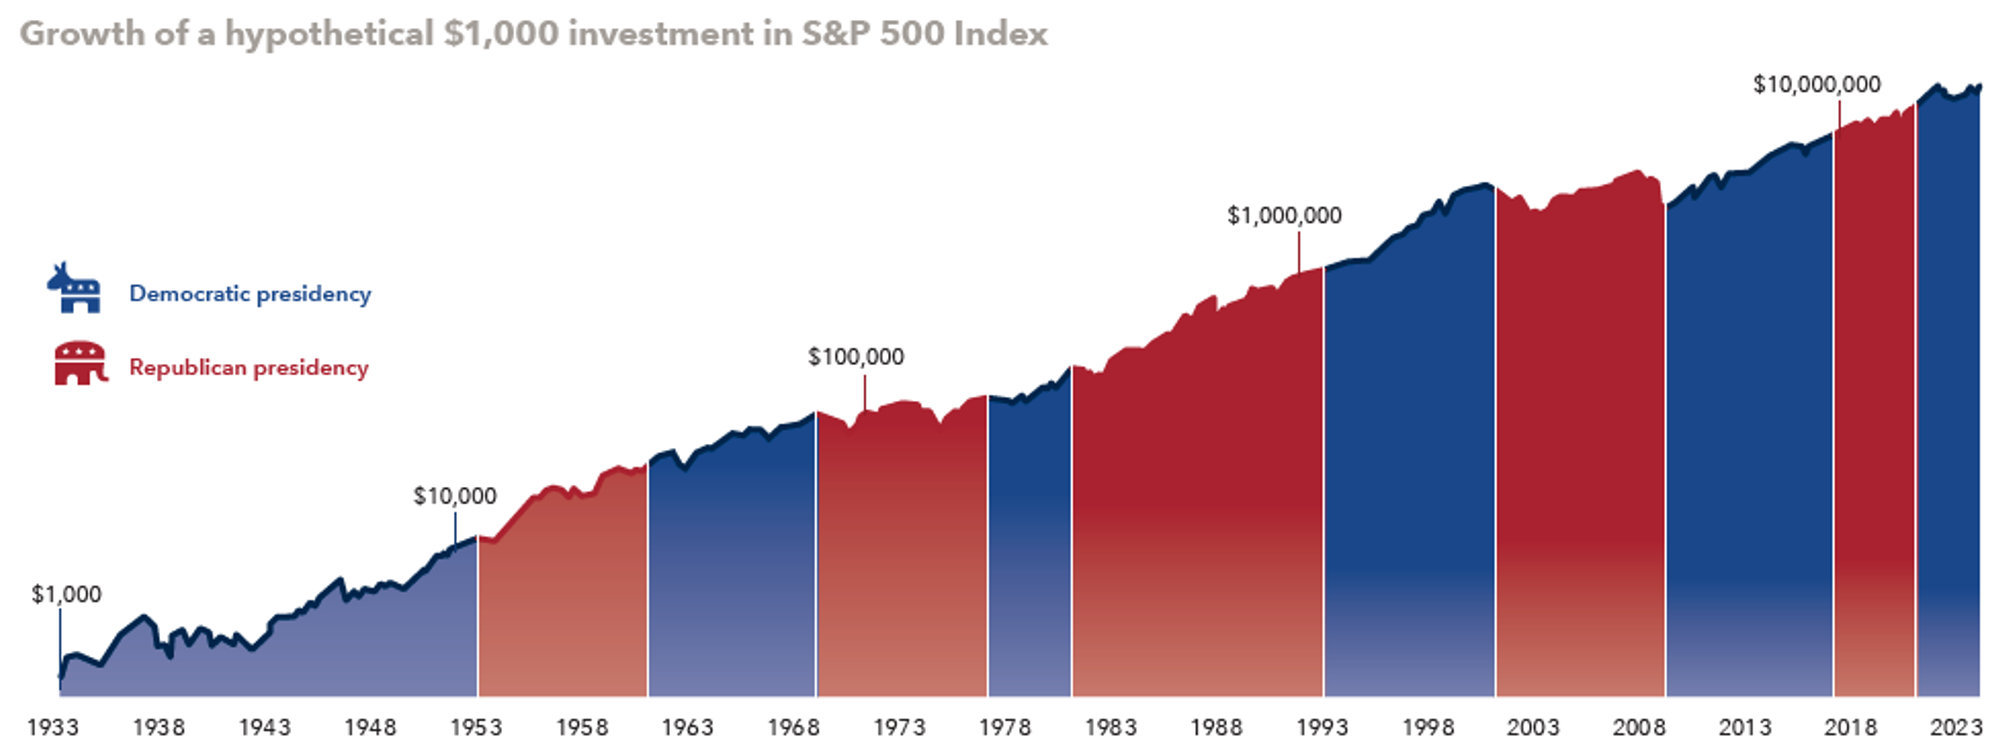
Keeping fear and emotion out of investment decisions bodes well for the long-term. Regardless of which party holds office, over time stocks continue to rise.
02 | Staying Invested Through Election Cycles Historically Provides the Greatest Returns
Some investors may think that stocks will underperform if a certain candidate or party is elected. Although changing fiscal, monetary and international policy do impact the economy, stock market returns are indifferent to who is the U.S. president, as seen above.
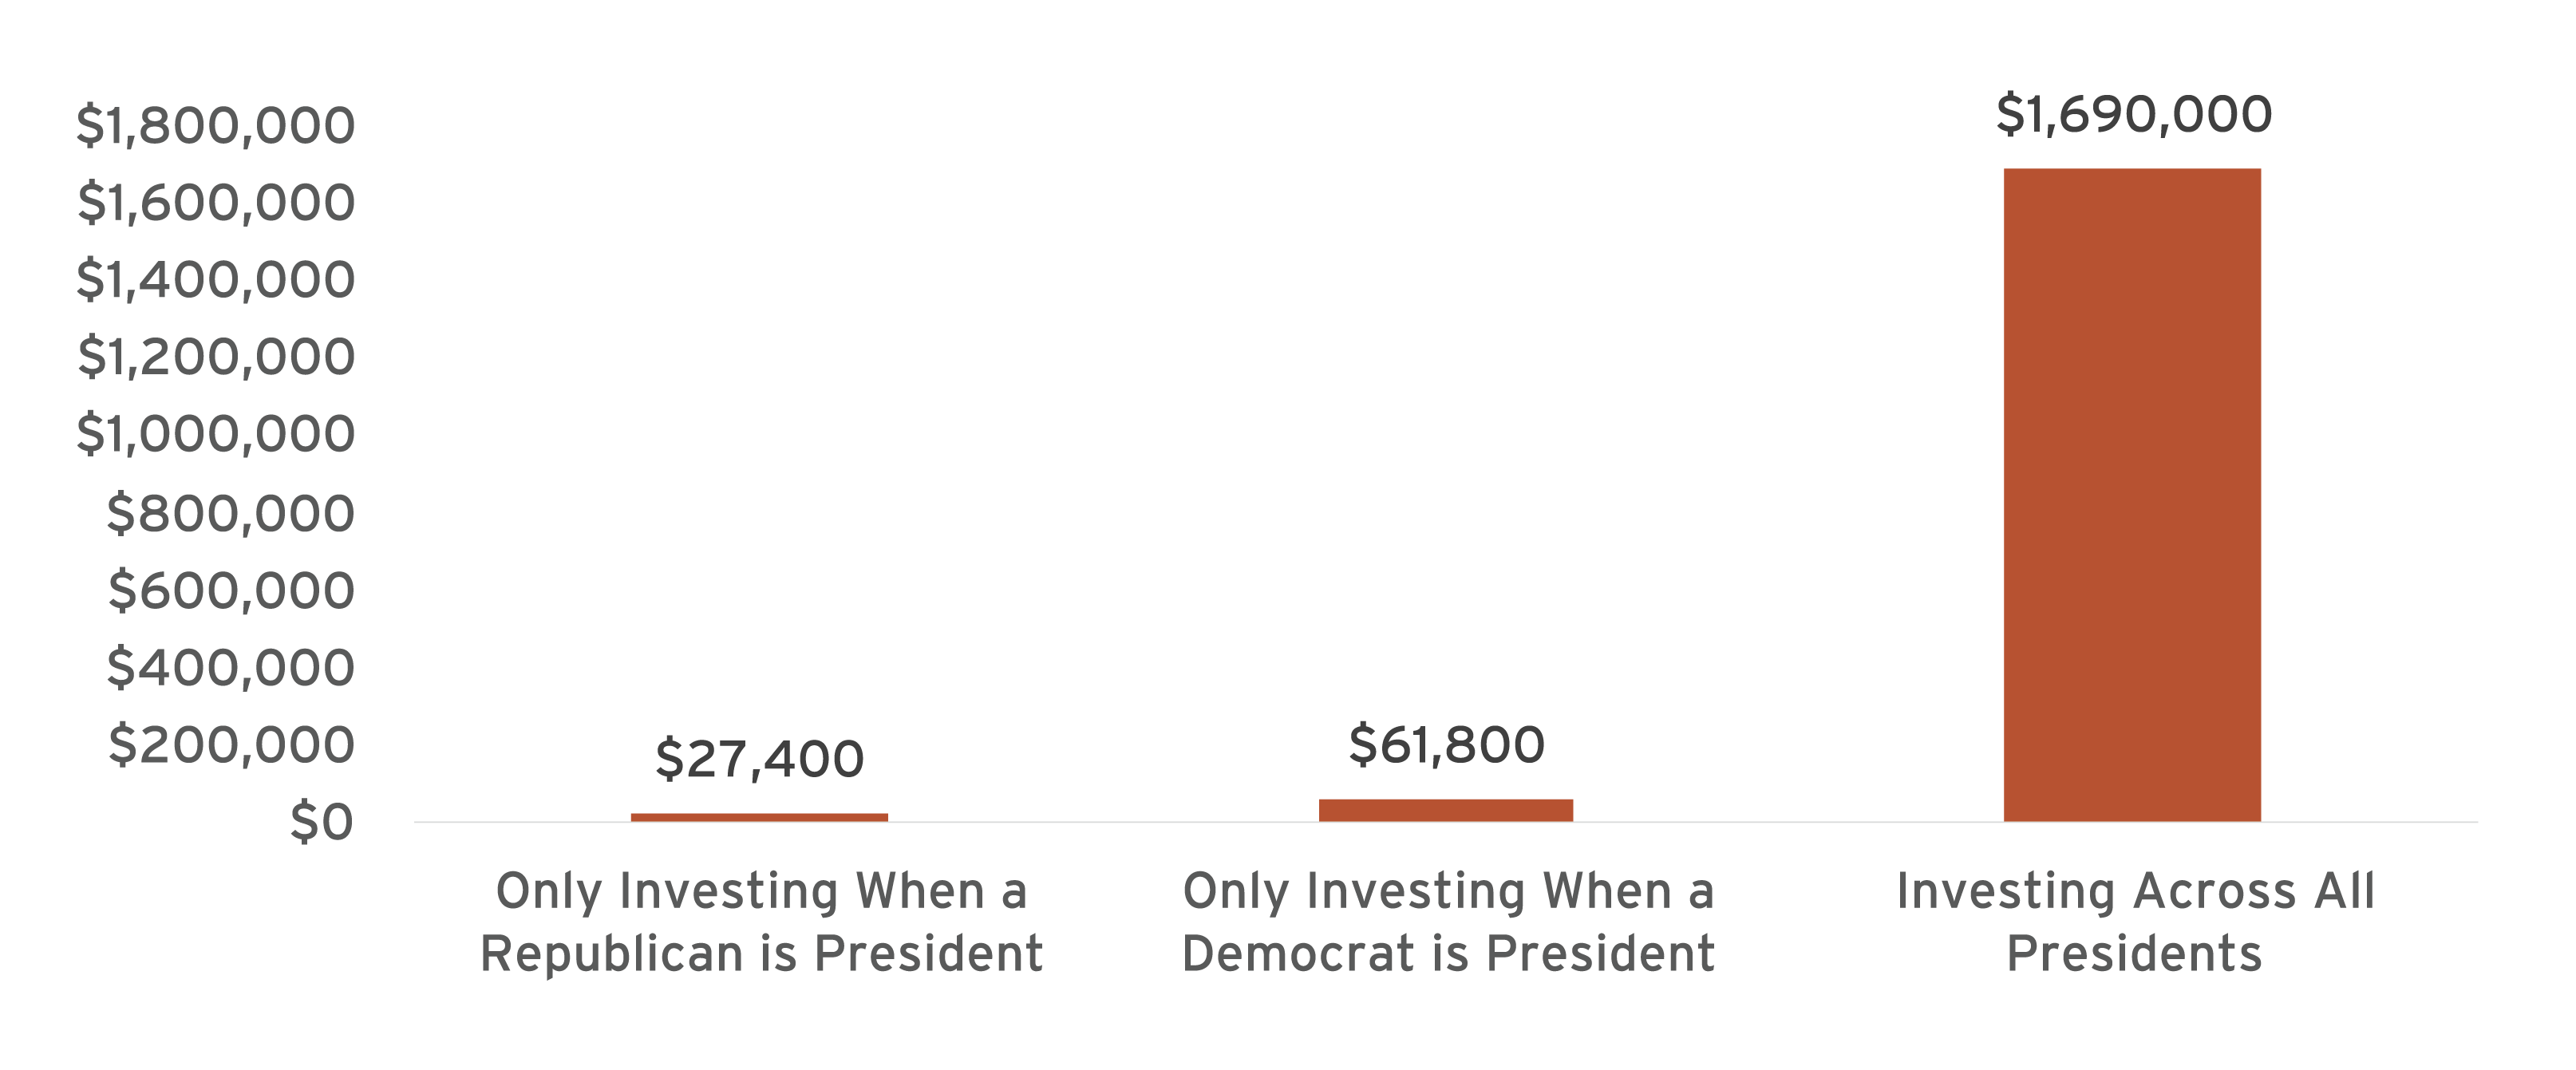
As the data shows, the greatest return on investment comes from staying invested through changing political parties. Staying fully invested through presidential cycles, regardless of which political party is in the White House, has historically generated the highest returns.2
$1,000 Invested In The S&P 500 Since 1953
03 | The Stock Market Has Historically Appreciated During Election Years
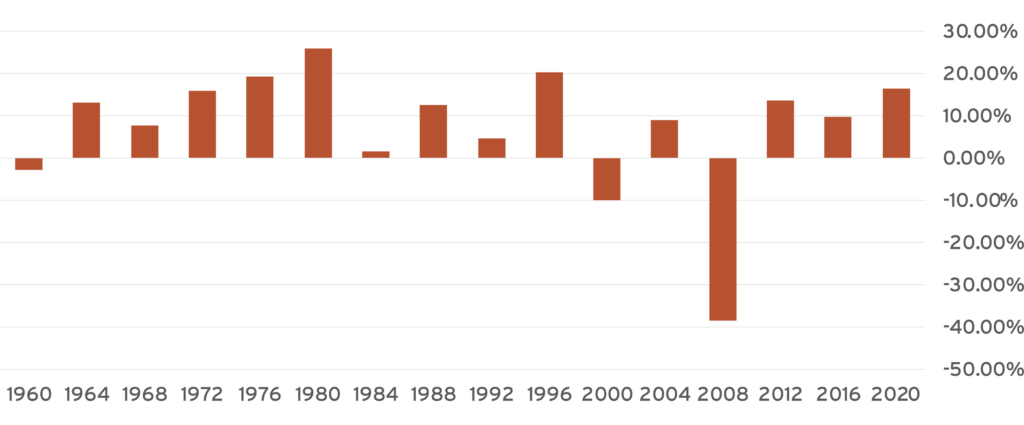
One might expect that heighted fear, volatility and uncertainty during presidential election years would result in stock market underperformance. The data shows otherwise.
Looking back to 1960, stocks have risen during 13 out of 16 election years (~81%), greater than the average historical probability of a positive year for the S&P 500 (73%).
S&P 500 Return In Election Years, 1960-2020
Source: FactSet (Chart). As of May 10, 2024
In the long run, time in the market will beat timing the market. Working with your advisor and sticking to your investment plan, especially during presidential election years, is a prudent decision.
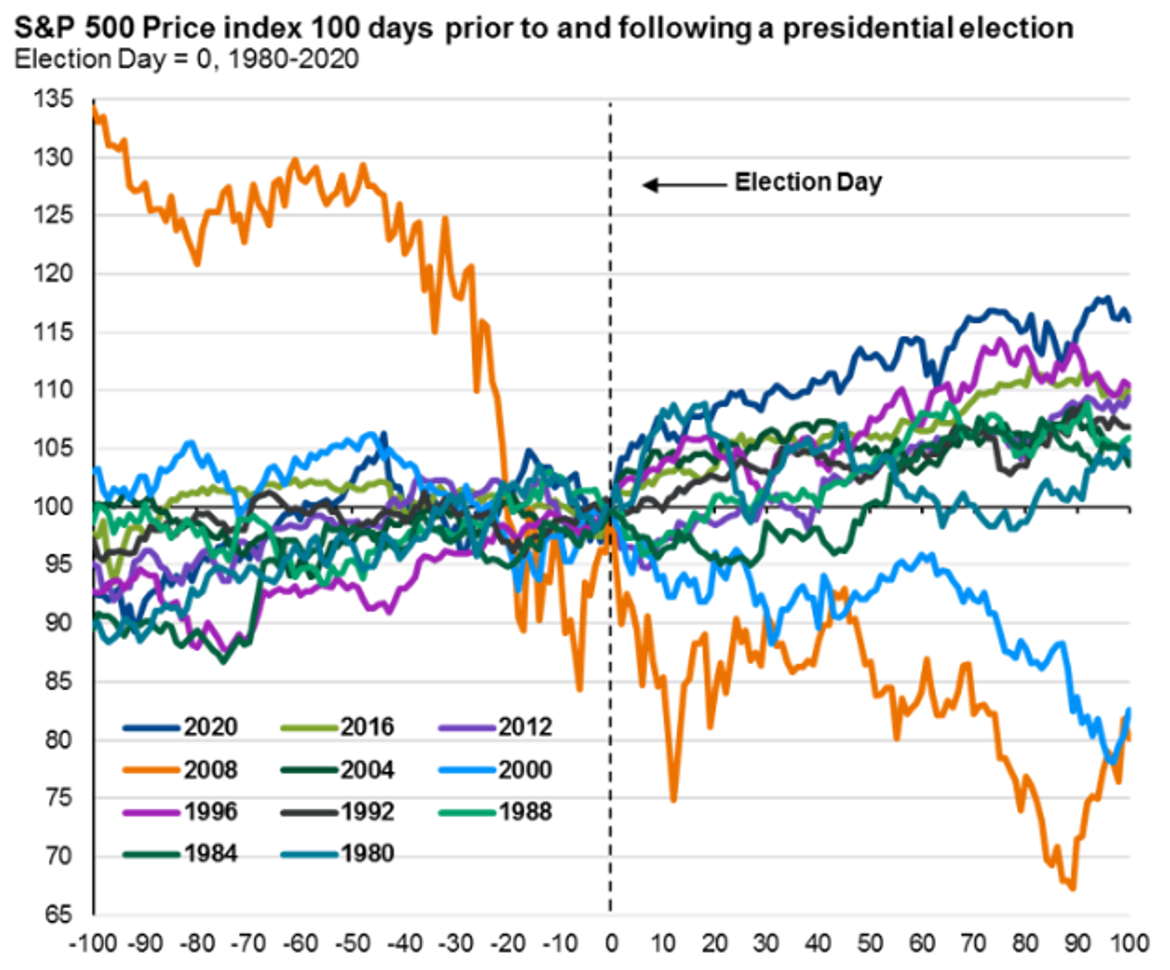
In addition, stocks tend to perform well near the presidential election date. During nine of the past 11 election years (2000 and 2008 as the outliers), on average stocks rallied during the 100 days preceding the election and were positive 100 days after the election.3
04 | Individuals Have Historically Increased Cash Allocations During Election Years, But Individuals Who Stay Invested Reap Greater Rewards
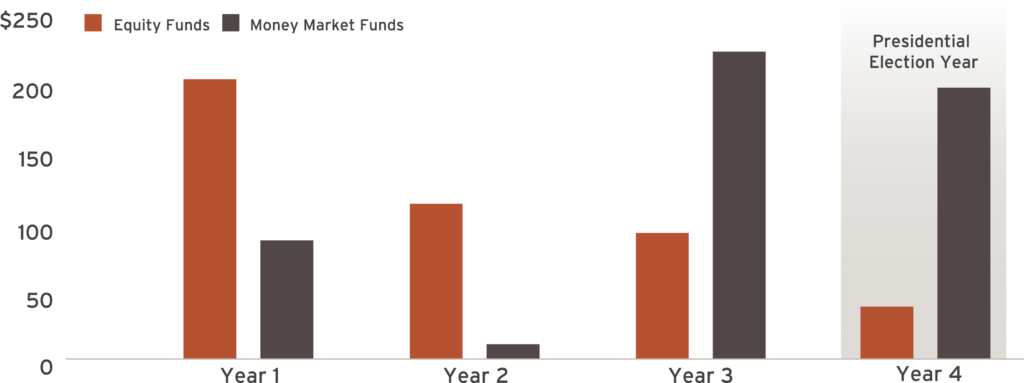
Cash allocations have historically risen during presidential election years, with equity fund flows lower in election years. For reference, during election years, an average of $50 billion flows into equity funds, relative to over $200 billion in the year following a presidential election.
Investors try to minimize risk in election years and increase risk after the election.4 This creates opportunities for those who stay patient. As Warren Buffet famously stated, “be fearful when others are greedy, and be greedy when others are fearful.”
Average Net Fund Flows By Year of Presidential Term (1992-2023)
Looking at presidential election cycles since 1932, sitting in cash rarely outperforms holding a diversified stock and bond portfolio. Researchers compared three different strategies over a four-year election cycle: 1) fully investing at the beginning of the election year, 2) dollar-cost averaging over the first 10 months of the election year, and 3) sitting in cash until the start of the year following the election.
The data shows that fully investing at the start of an election year has historically provided the highest returns.5 Dollar-cost averaging in the first 10 months comes in as a close second, and holding cash for the entire election year, then investing in the following year, provides the lowest returns.

CONCLUDING THOUGHTS
Overall, investing through elections years can be a daunting task. We highlighted the historical data, and empirical evidence shows maintaining allocations in diversified portfolios, and not basing investment decisions on political parties, is the most probable way to increase total returns. As always, work with your financial advisor to understand your plan.
