Throughout the year, you have heard us talk about the term, as often referenced in the media as the “Magnificent 7”, the 7 companies whose returns have driven an overwhelming majority of returns year-to-date (YTD). Another interesting data point we have found as it relates to the high degree of concentration in today’s market is seeing how much of the S&P 500’s YTD is coming from the Top 10 largest weights within the index. As the table illustrates, what we have witnessed so far this year is unprecedented! Over 130% of the price return for the S&P 500 has come from the 10 largest stocks, this is nearly double the level of contribution that previously held the high mark in 2007!
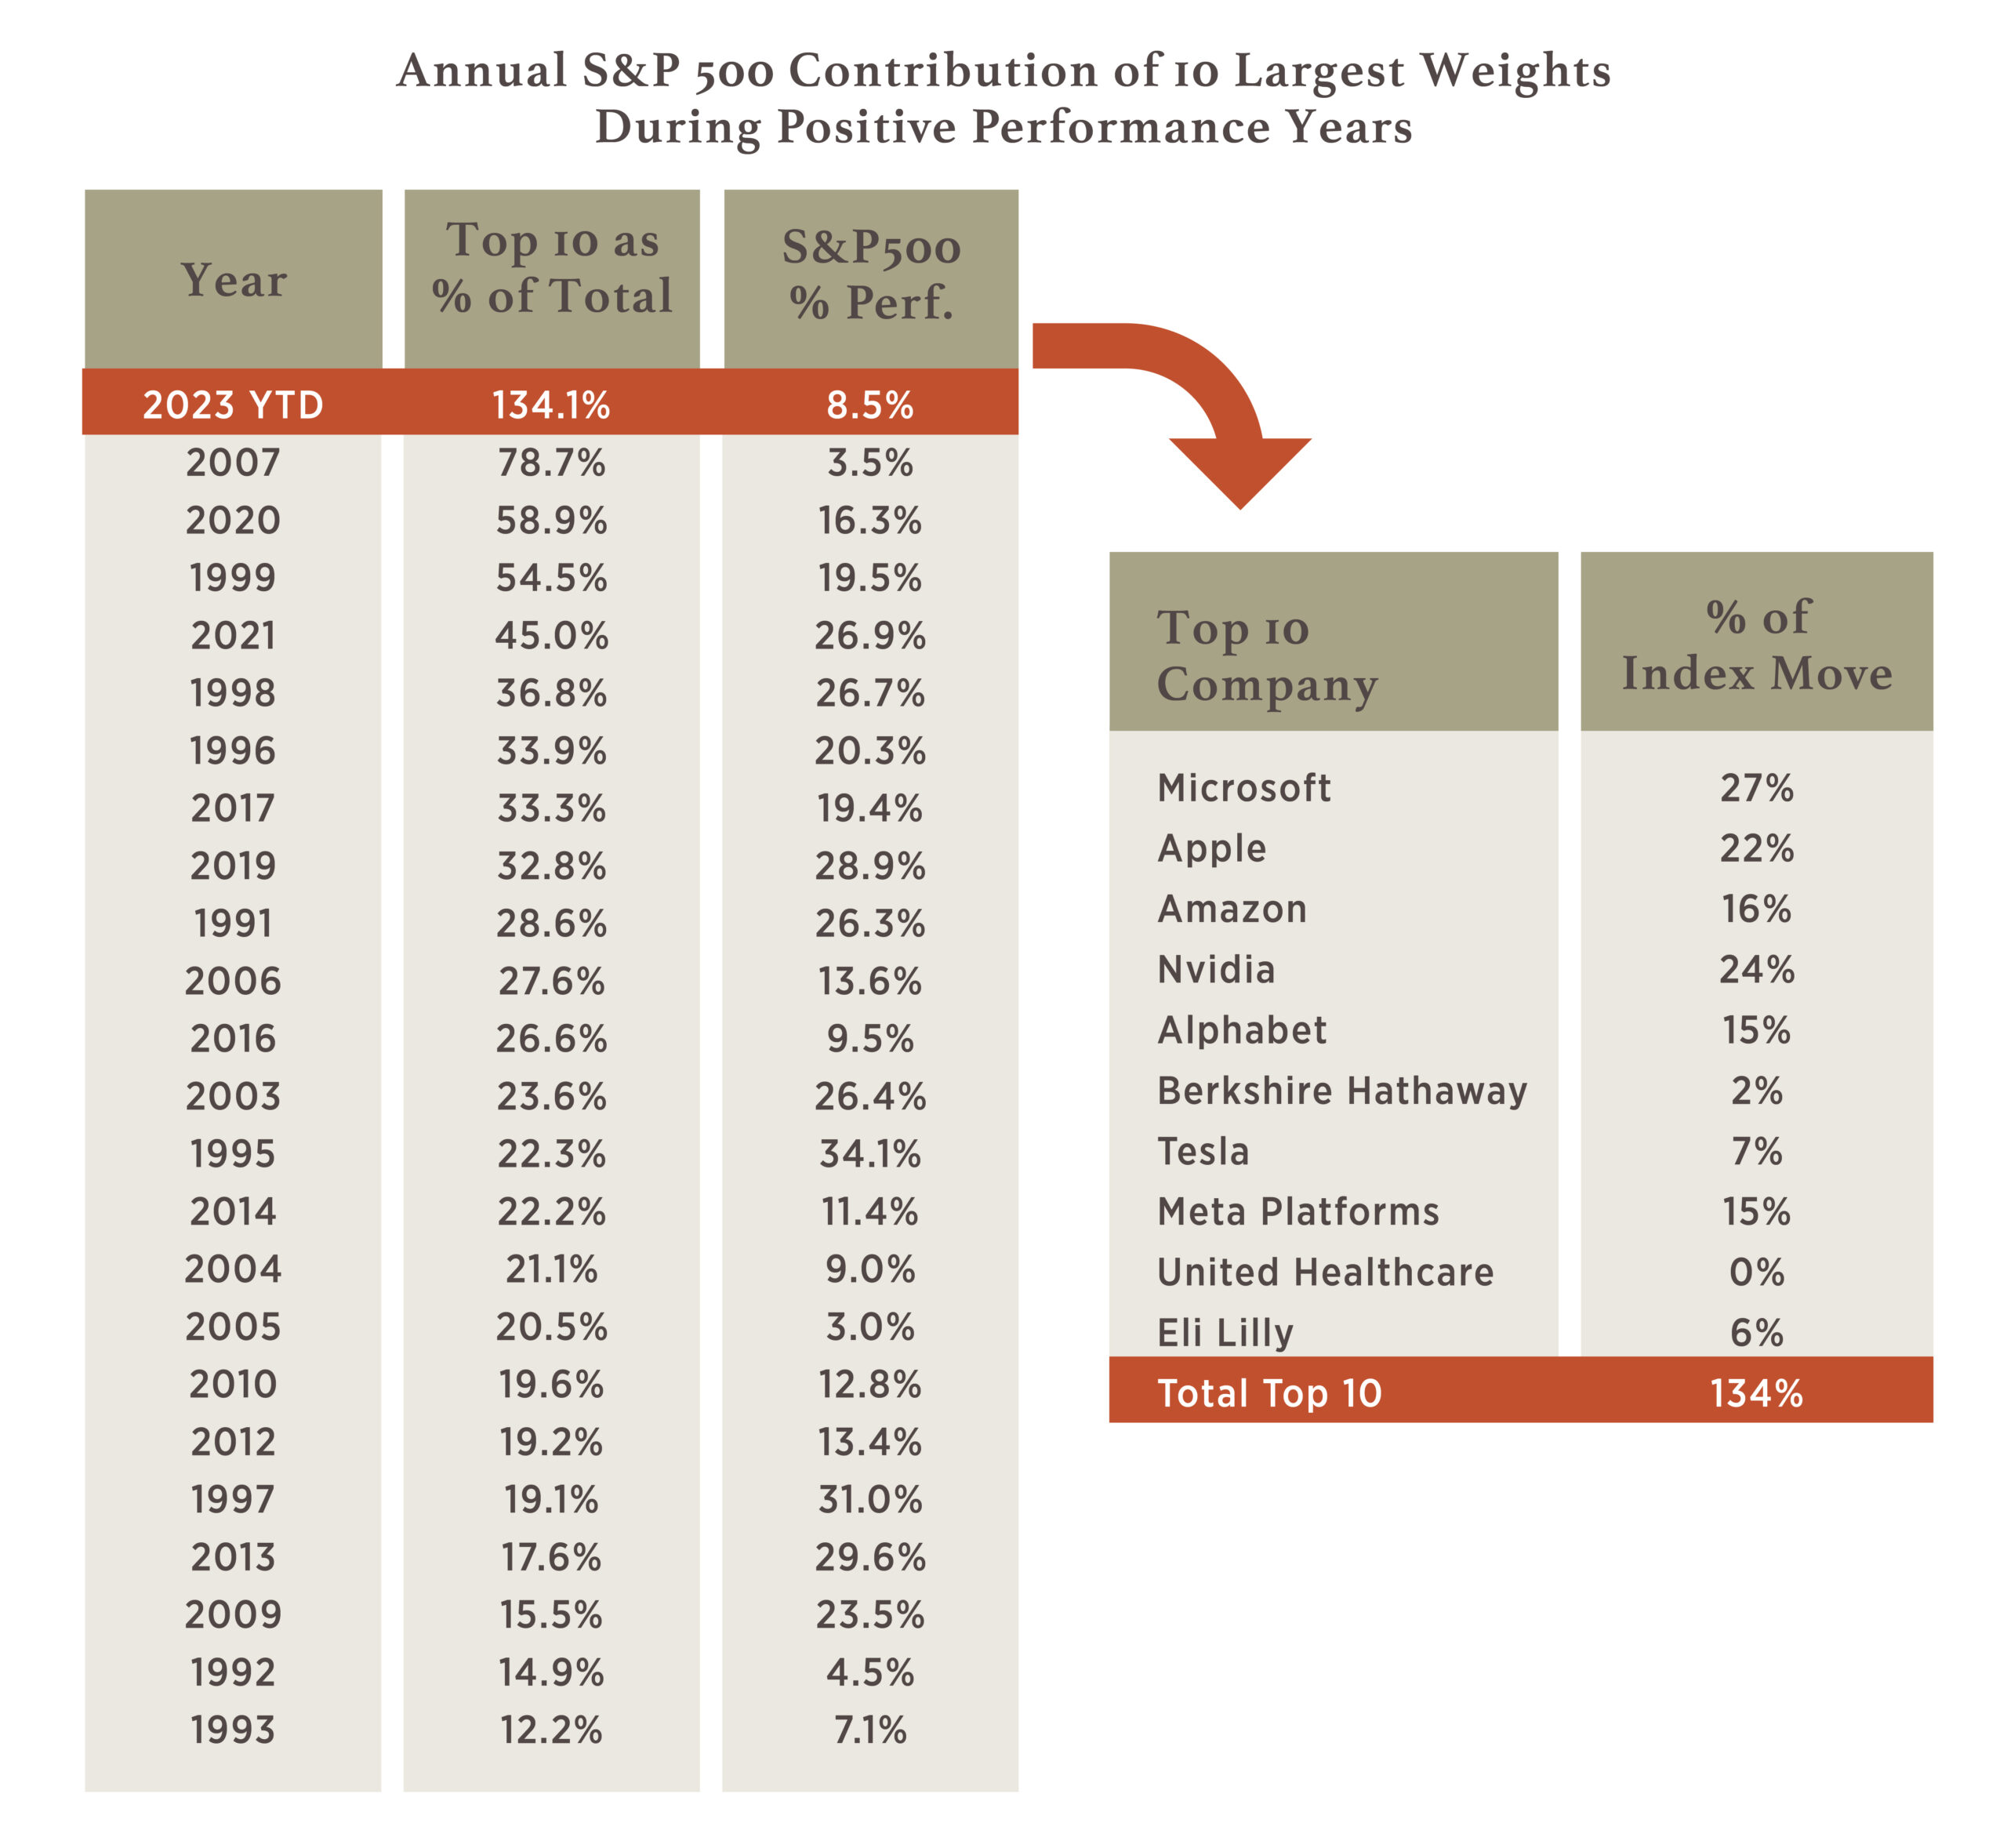
Source: Strategas and Bloomberg; Data as of 10/30/2023 – returns reflect price return only
What it tells us is that the other 490 stocks are collectively down for the year. This doesn’t mean that all 490 securities on their own are down, in actuality the split between positive and negative stocks is 40% up and 60% down. But as we have explained in prior posts (March 2023 Viewpoint), the S&P 500 is a market-cap weighted index and thus places greater emphasis on the larger companies. Another way to illustrate this is in the graphic below where we market-weight each respective cohort into the “Top 10” and “Other 490”. In other words, owning a market-cap weighted portfolio of the Top 10 largest valued stocks would have produced a total return of 47.1% whereas only owning a portfolio of the other 490 stocks would have been a drop of 2.6%.
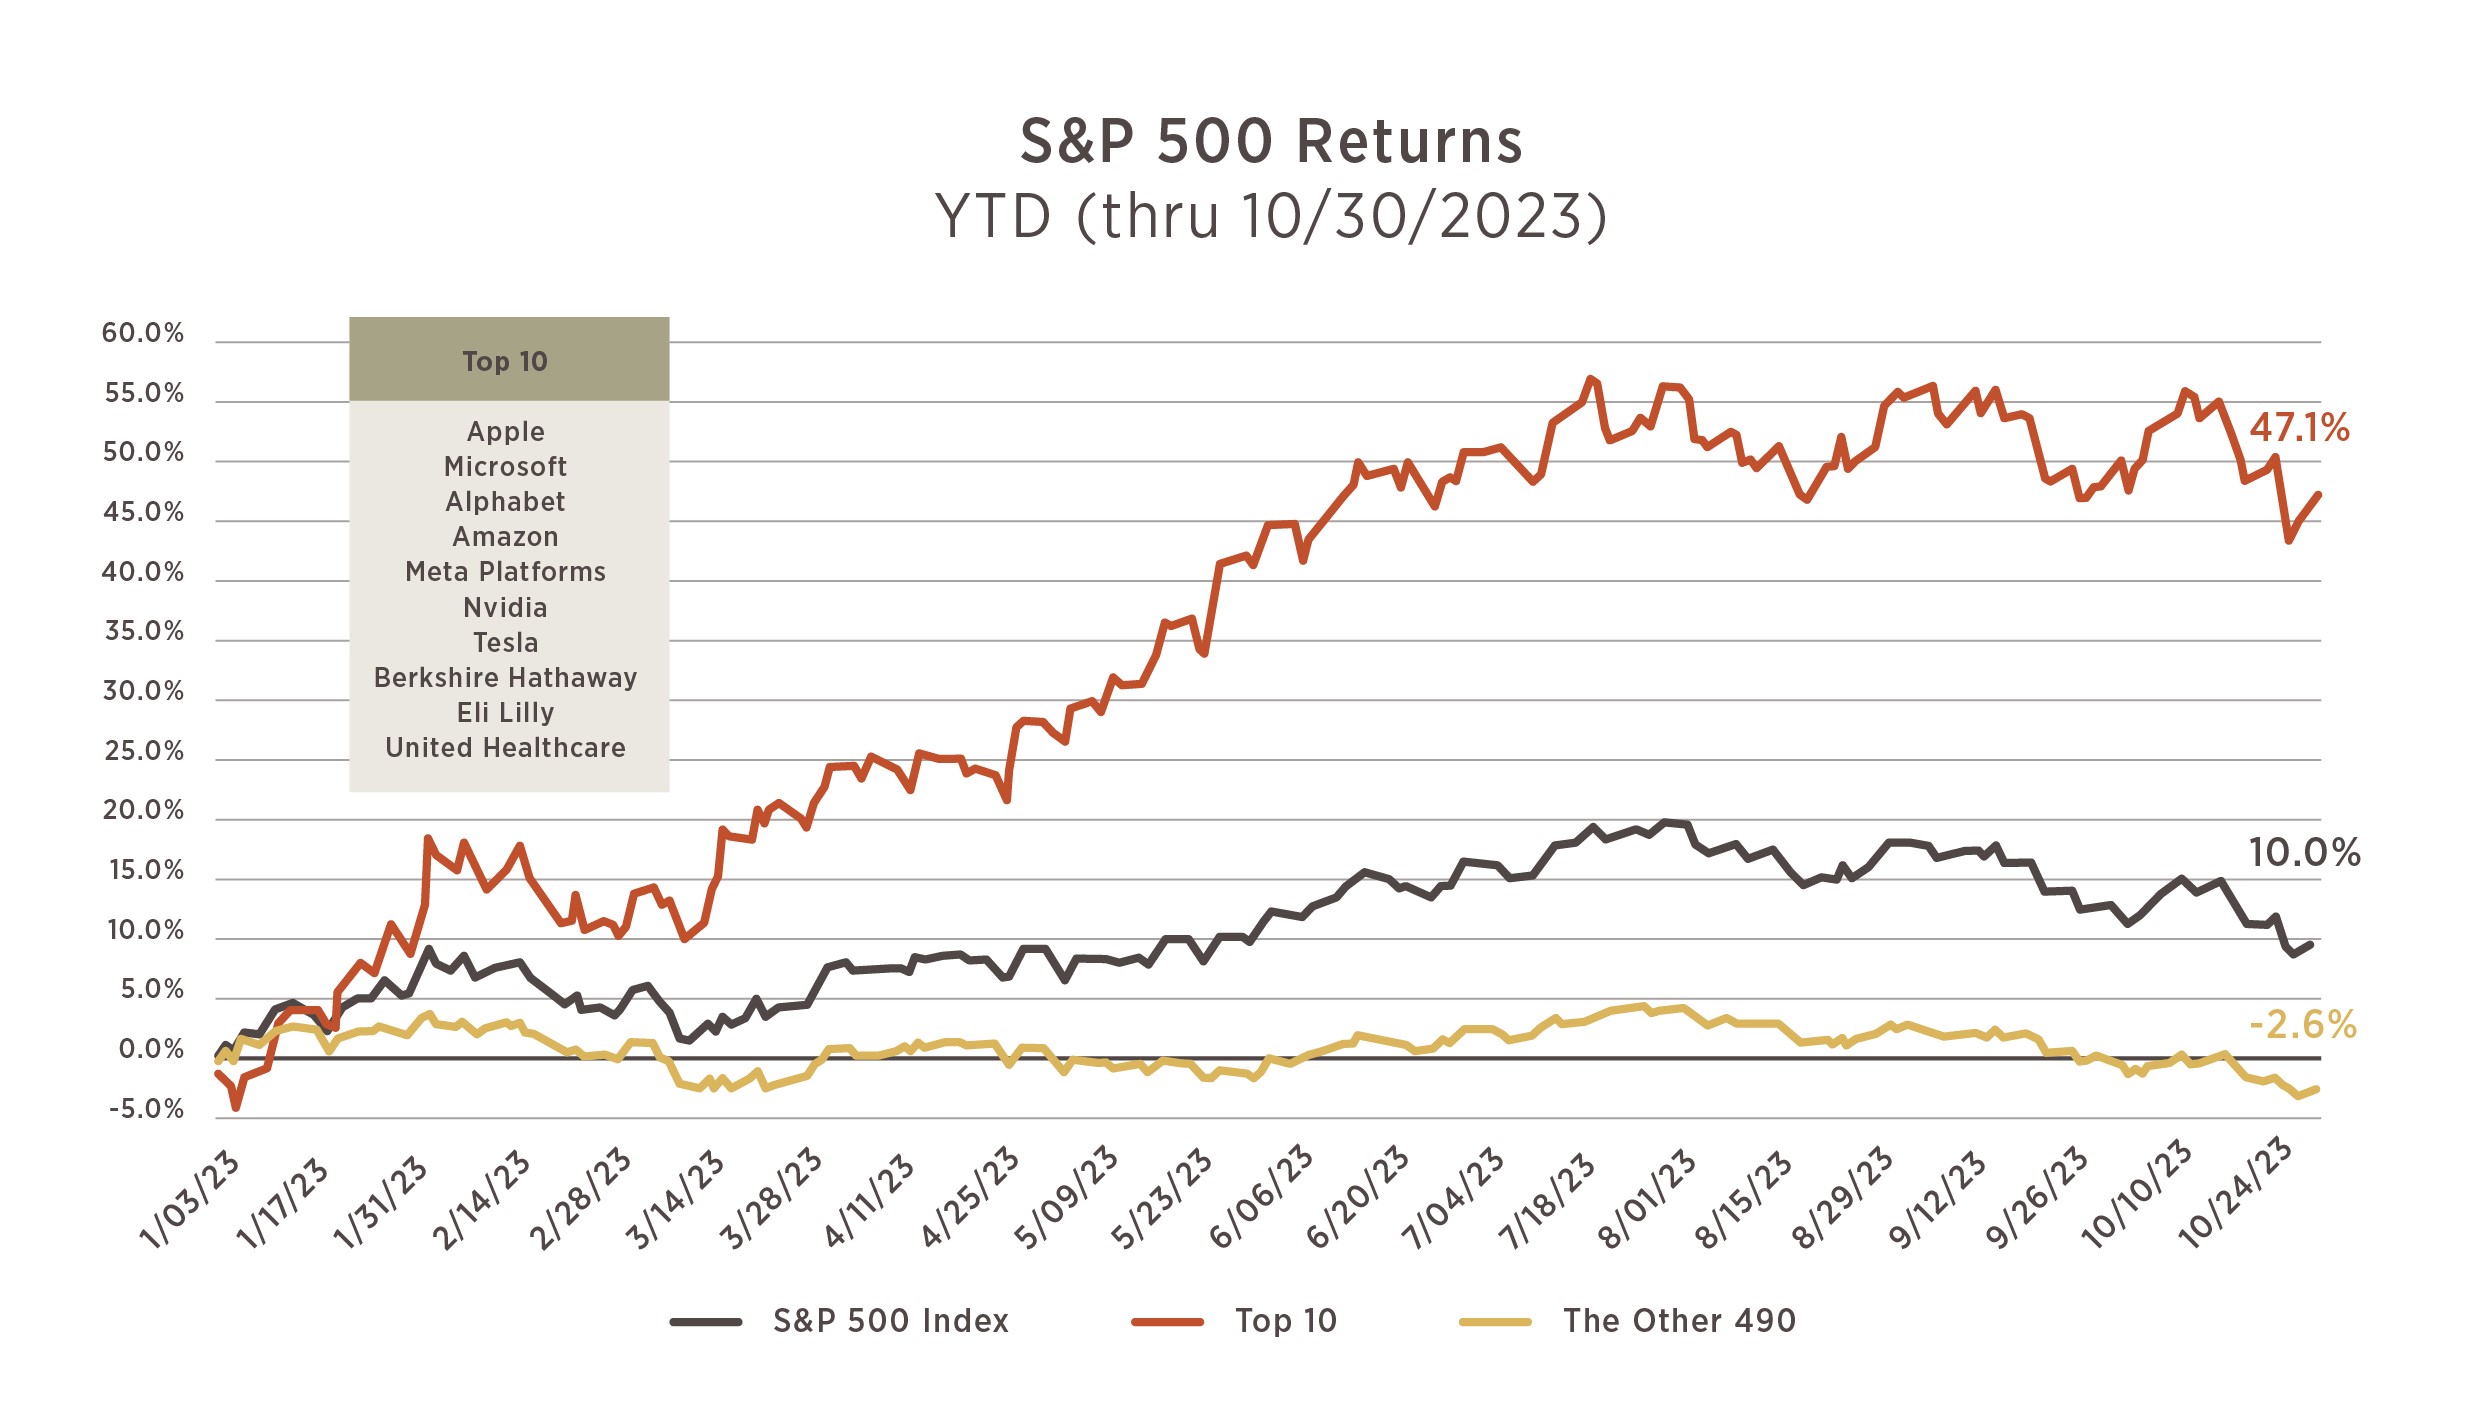
Source: Bloomberg; As of 10/30/2023. Calculations done using a free float adjusted market capitalization on the Top 10 securities noted using daily data.
This is the first time we have seen this occurrence and in fact, the weight of the Top 10 stocks has never been as large as it is now. As the graphic shows, nearly 1/3 of the market cap today is concentrated in these 10 stocks. To think of it another way, if you own the S&P 500 and that is the only asset you own, 1/3 of your portfolio is in 10 individual companies. We are not suggesting these are poorly run businesses, but the fact of the matter is, the weight they pull is substantial in determining the return of the market – the most substantial weight we’ve ever seen.
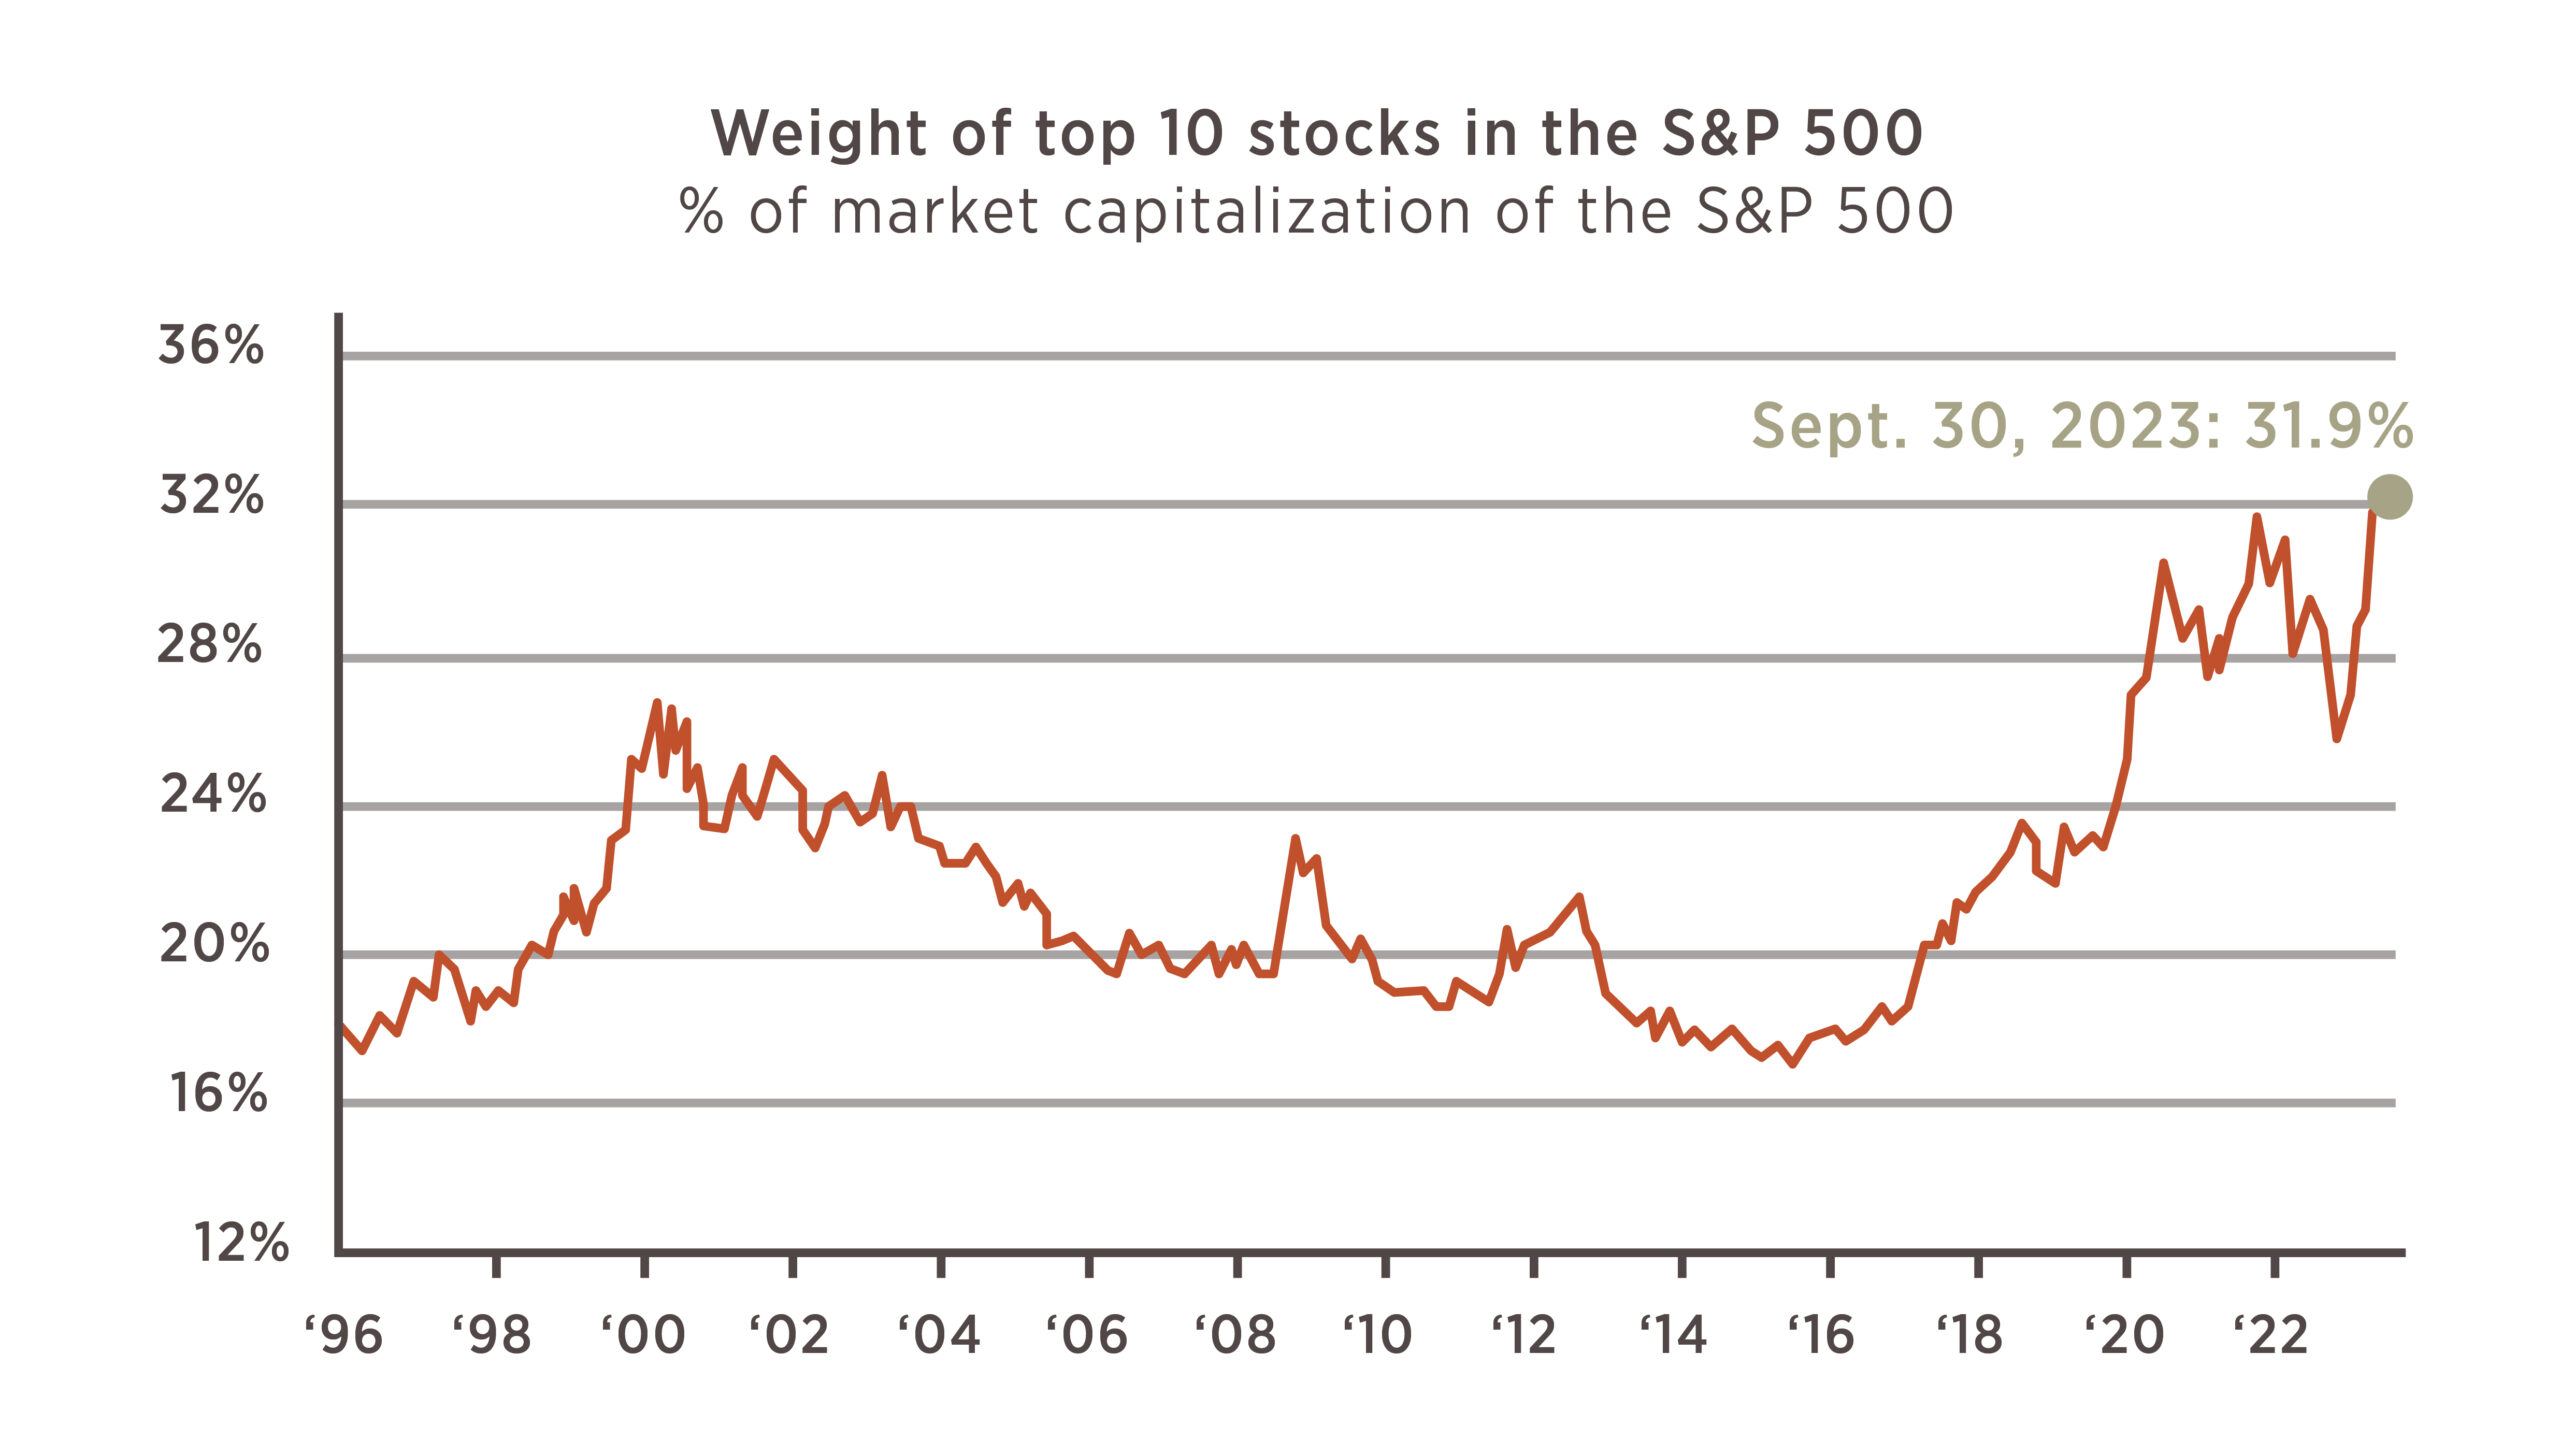
Source: JPMorgan Guide to the Markets; As of 9/30/2023
This narrow movement in the market, as unprecedented as the numbers are, has been fascinating to watch unfold. However, we remain proponents of a diversified portfolio and the benefits diversification can provide over long time frames of investing. The continued growth of the 10 largest stocks starts taking away from some of that diversification as the market index becomes more concentrated in a narrow cohort of companies. This is all to say that at some point, odds are in favor of at least some of the Top 10 stocks underperforming or the other 490 start outperforming to get the market more in balance.
For questions or comments, please contact your financial advisor.