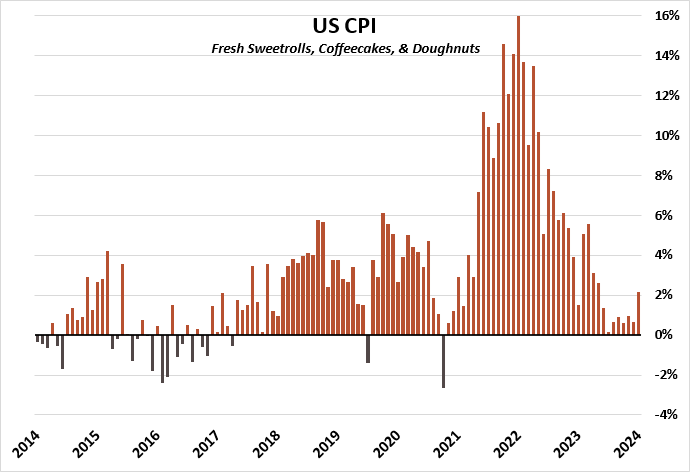
We likely don’t need to remind anyone that inflation hit levels not seen since the 1970s just a few years ago with the “Headline CPI” notching 9% in September 2022! And you don’t have to search hard for anecdotal evidence either – our very own Friday morning donut run is bound to get the one in charge of buying to squawk about how expensive it has become.
Because those of the traditional working age (20-65) have never encountered such a dramatic shift in price levels, it is understandable that consumers are left irritated with the costs of goods and services in today’s economy. Should any relief be expected? The short answer is “no,” but let’s dive into the details.
Terminology Breakdown
1) Consumer Price Index (CPI)
- Headline CPI – the entire basket of goods and services, including food and energy. This is the most oft-cited measure by the media, hence the term “headline.”
- Core CPI – this measure excludes both food and energy due to their price volatility.
- Core Goods – about 25% of the Core CPI measure – things like vehicles, home goods, clothing, etc.
- Core Services – about 75% of the Core CPI measure – heavily weighted towards shelter, but also inclusive of medical care, airline fares, auto insurance, etc.
2) Personal Consumption Expenditure (PCE)
- This is the Federal Reserve’s (Fed) preferred measure of inflation due to its broader scope and is quicker to capture changes in consumer preferences.
The Big Picture
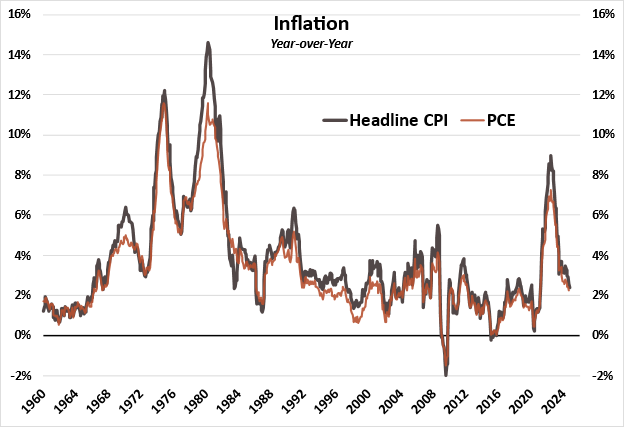
A look at historical inflation will show it is both common and expected for prices to rise over time. It is very rare to see deflation in the U.S. economy – since 1960, the annual Headline CPI has experienced deflation <2% of the time, and on both occasions (2009 & 2015), energy prices were the primary cause.
As stated in our terminology above, most people are going to pay attention to the Headline and Core CPI figures; however, we illustrate here both the Headline CPI and PCE measures of inflation to give some perspective on how they historically differ. This is important when considering the U.S. Fed targets 2% inflation, because they are making reference to PCE. Over the period shown, Headline CPI averages +0.50% higher than PCE, thus, it could be roughly translated in that the Fed targets ~2.5% Headline CPI.
Certainly, by viewing this graphic, it is evident the U.S. experienced an unusual price shock that has not occurred in a very long time.
How did we get here?
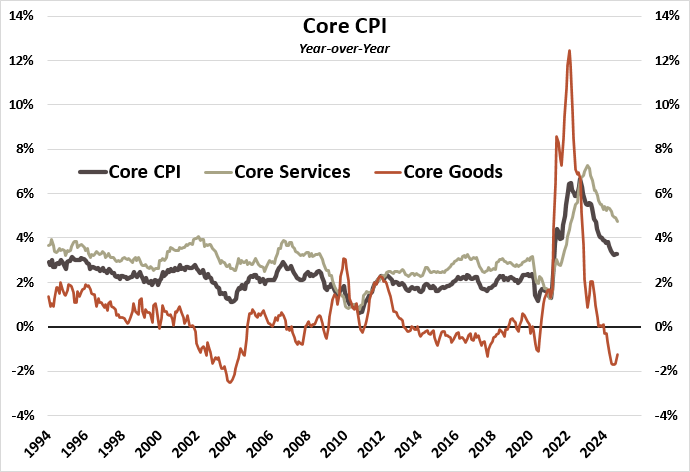
A quick rewind takes us back to 2020; yes, the “COVID” year. Consumers bought up “goods” at the same time production of the “goods” had slowed tremendously. This created a supply chain bottleneck that sent the prices of those “goods” higher, much higher. In fact, the measure of Core Goods inflation peaked at a +12.3% in Feb. 2022 before rapidly falling once consumers no longer needed any more TVs or ran out of home remodel ideas.
Core Goods since the start of 2024 has experienced deflation, meaning the price of goods have actually declined year-over-year. Deflation in goods for the U.S. economy is not uncommon, a result of the globalization of trade and creation of cheap products. Most of U.S. goods deflation has occurred post-1999, and in the chart below, it shows goods have been deflationary for nearly 40% of the last 30 years.
“Services” were much slower in experiencing inflationary pressures, but, considering that the U.S. is a service-based economy, its impact is felt more broadly than “goods.” Hence, when measuring inflation, it is heavily weighted towards “services.” The measure of Core Services did not peak until Feb. 2023 at +7.3%, a full year later than Core Goods.
This story is not new; it was heavily influenced by shelter costs rising amidst work-from-home policies, stimulus money, all-time low mortgage rates, and a structural shortage of housing supply. Core Services inflation has started to slow down, termed disinflation, but remains elevated from a historical perspective.
Neither of the measures referenced above capture what happens in food and energy because they are often removed due to their volatility. We think it is kind of silly to ignore them; after all, we need to fuel both our bodies and vehicles, but nobody asked for our opinion!
Is Inflation Improving?
This is where things get tricky. As our prior charts show, yes, the pace of inflation has declined substantially; however, that does not mean that prices are lower! That simply means prices are not increasing as fast as they had been – termed disinflation.
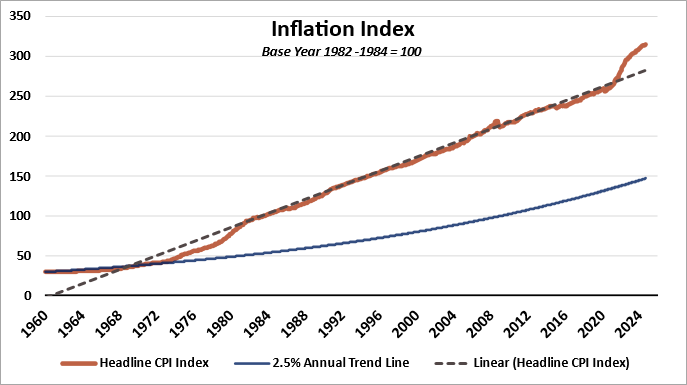
Defining “victory” over inflation can be done a variety of ways, and neither the media nor politicians portray this concept very well. The reality is, despite good reason to cheer for lower inflation after a big surge, prices are not going back to where they were before this recent inflationary period, as illustrated below.
Our next chart illustrated the Headline CPI Index since 1960. As one would expect, this should trend upward because the economy almost always experiences “inflation” not “deflation.” What sticks out is how far above the current price level is relative to the linear trend line. It is the first episode in which we’ve seen such a divergence.
Secondarily, we have illustrated what the price level would look like had inflation been constant at a 2.5% rate since 1960 (2.5% Trend Line). Clearly, price levels significantly higher than had the 2.5% annual inflation been the case. Now, the usage of 2.5% is a hypothetical exercise for illustration because the U.S. Federal Reserve did not publicly state their “inflation target” of 2% PCE (remember this equated to ~2.5% Headline CPI) until 2012.
Reason to Gripe?
We mentioned our own anecdotal evidence here at the office regarding the cost of our Friday donut run. As it turns out, there is data to back up the assertion that they have in fact become more expensive. In September 2022 the annual price rose by 16% vs. September 2021!
In Summary
As we mentioned at the start, generations have encountered a price shift unseen at any other time in their life. there are a variety of narratives via the media, politicians, etc. that do not provide much perspective on what has occurred.
But the conclusion we hope you take away from this is that it is highly unlikely prices will move lower (deflation) and that you should expect continued price level increases albeit at a much slower pace (disinflation) than was experienced in the middle of 2022. After all, the Federal Reserve does operate with a dual mandate of (1) price stability and (2) employment with a publicly acknowledged target of allowing prices to grow at 2% per year on average.


