Sharpe Ratio is a measurement of the risk-adjusted return of a portfolio. The concept is named after William F. Sharpe of Stanford University. The ratio measures the return on the funds in excess of a proxy for a risk-free guaranteed investment relative to the standard deviation. Generally, the 90-day Treasury bill rate is the proxy for risk-free rate. The ratio gives the investor an idea of how much extra returns he is earning in the volatile market for holding a riskier asset. The whole idea behind calculating the Sharpe ratio is to know the compensation an investor is getting for the additional risk he is bearing for not holding a risk-free asset.
The below graph depicts the Sharpe Ratio of the S&P 500 dating back to the start of 2011. As you can see, the ratio has consistently held above 2 since March of 2021 – a rare feat over this time horizon. It shows that by investing in the index over the past 9 months, you could have received 2x the return for the amount of risk being taken.
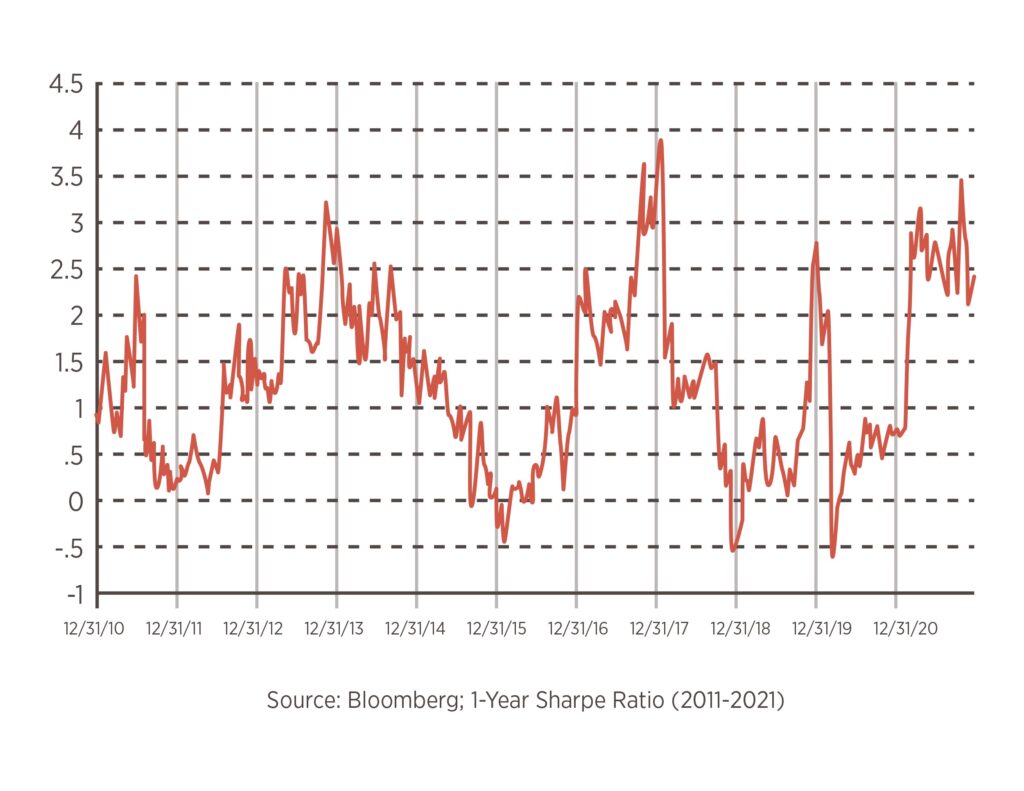
It has been a year of continuous new highs, and It has been a year of continuous new highs, and in fact, as of 12/28/2021, the S&P 500 has hit 69 new all-time highs in 2021 alone. This is the second highest rate of “new-highs” of all time, with the record being set at 77 in 1995. This has helped dampen the volatility in returns and has been supportive of the Sharpe Ratio maintaining its relatively consistent level throughout the year.