There is no single indicator that can tell us how best to invest. However, we find it is vital to keep pace with economic and market data that show what current and potential future trends are taking shape. To do this, we look at signals from equity and fixed income markets as well as from the real economy.
Here are some of the indicators we use to map out where the economy and markets may be headed.
Economy
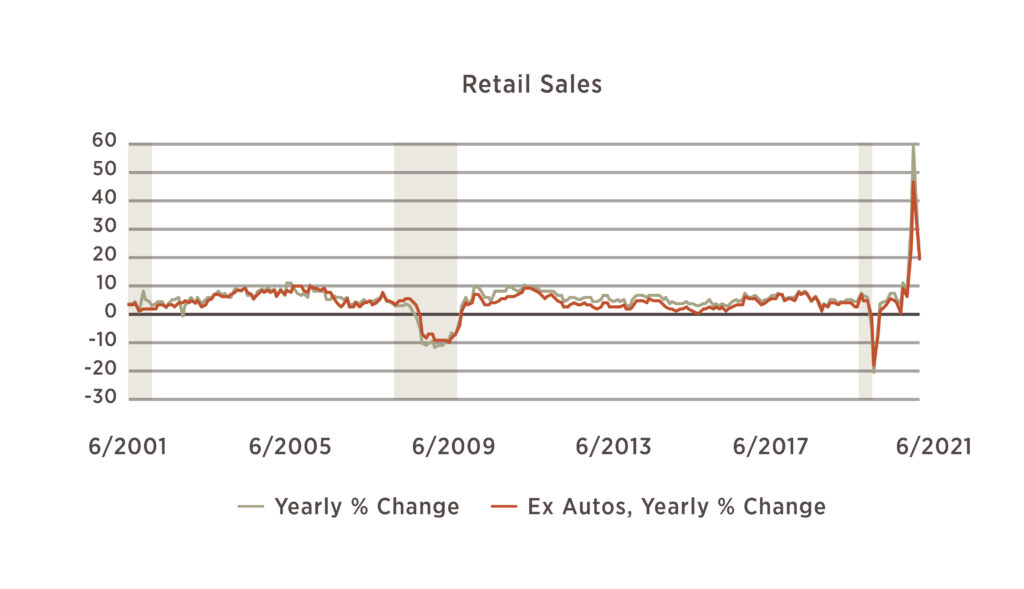
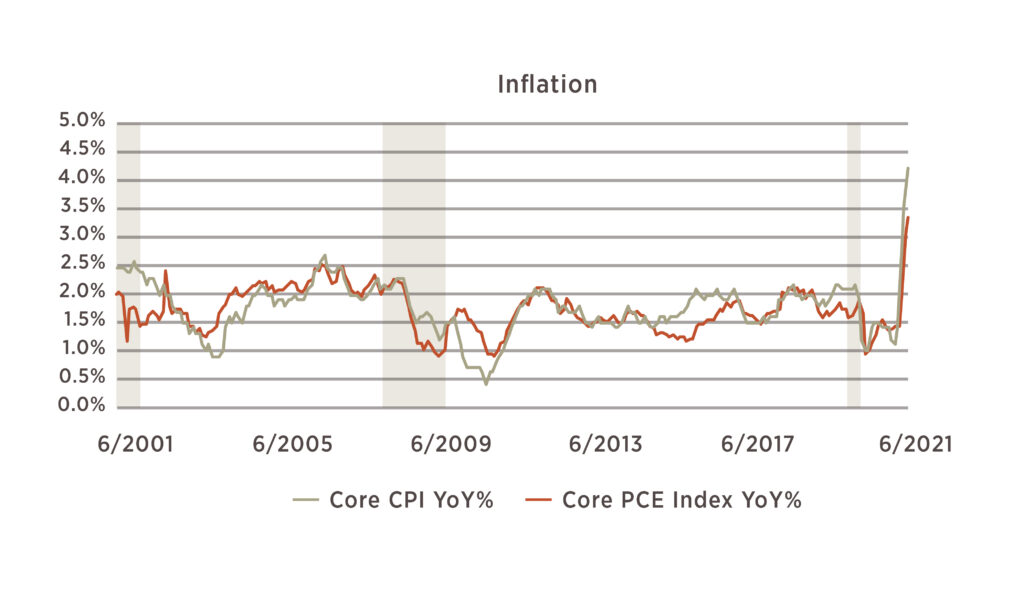
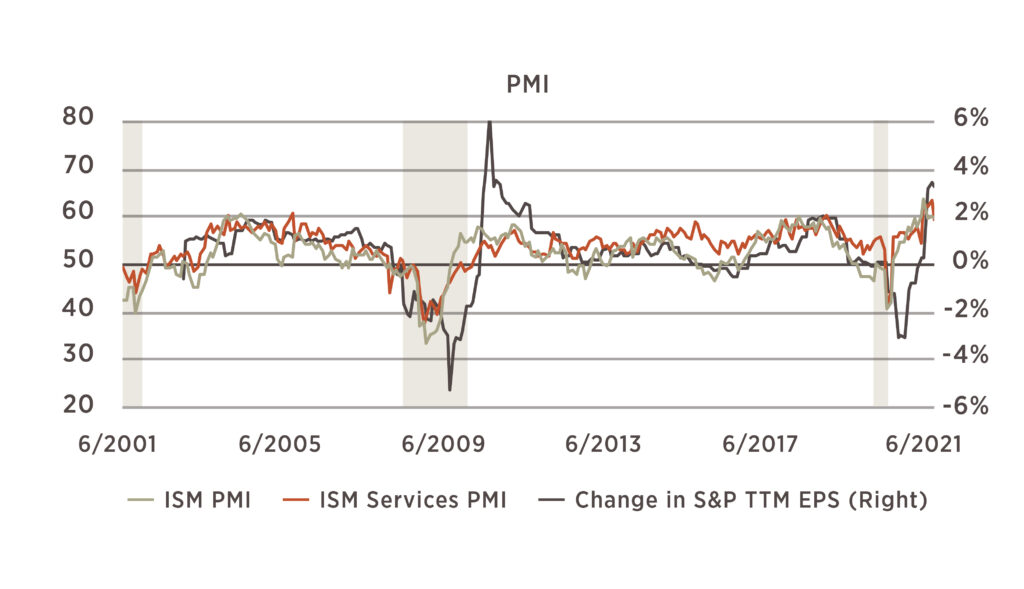
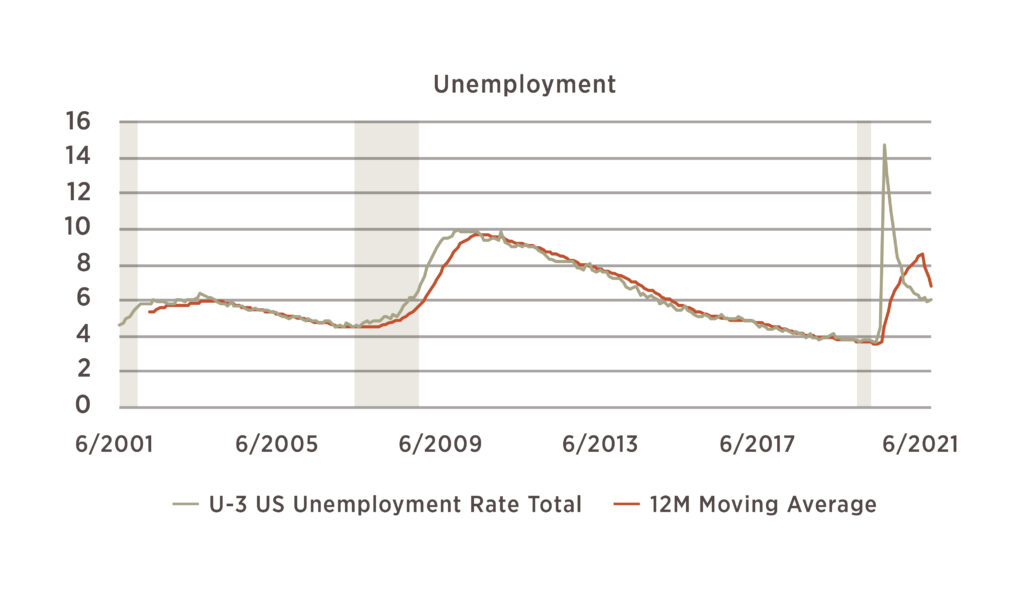
Economic data for the month of June show that the peak rate of growth may have passed in year-over-year terms but remains expansionary nonetheless. Unemployment remained stubbornly high near 6% but retail sales continue to show double digit growth over the levels of last summer. Inflation has been in the headlines due to high prints – the June core CPI showed a 4.5% increase over the prior year. However, the majority of this increase reflects low prices last year and the effects of demand in sectors particularly affected by economic reopening such as hotels, airfares, and rental cars. Both of those effects should wear off as the economy normalizes. Both the manufacturing and services PMI indicators continued to show strong expansion at 60.6 and 60.1, respectively.
Forward Indicators
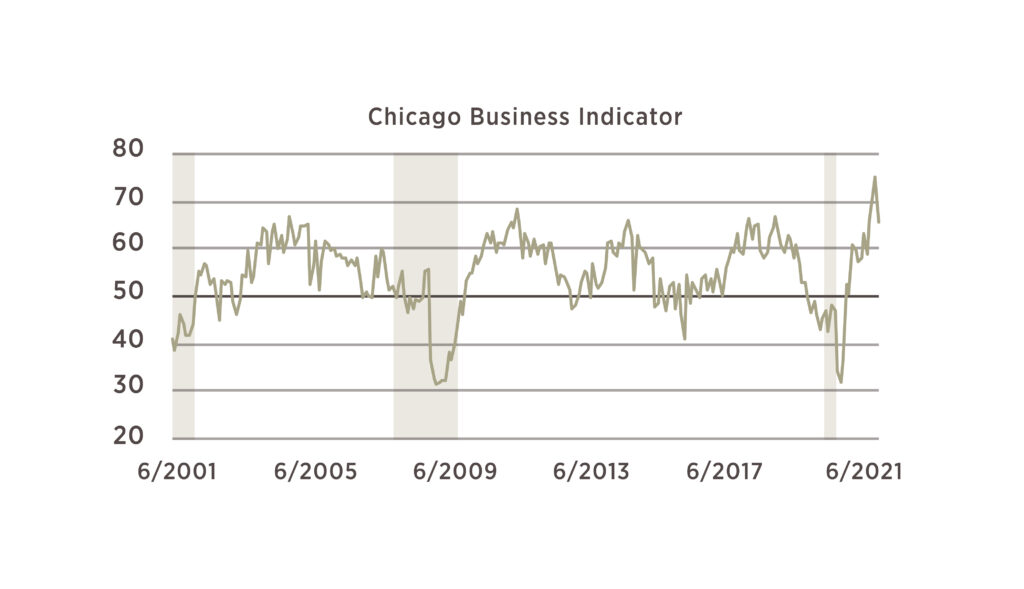
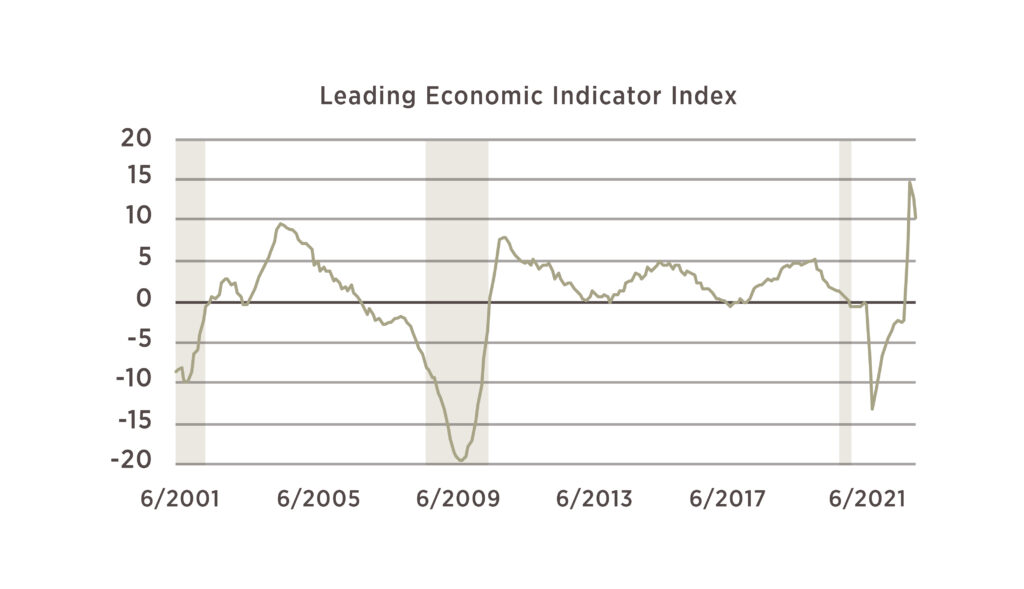
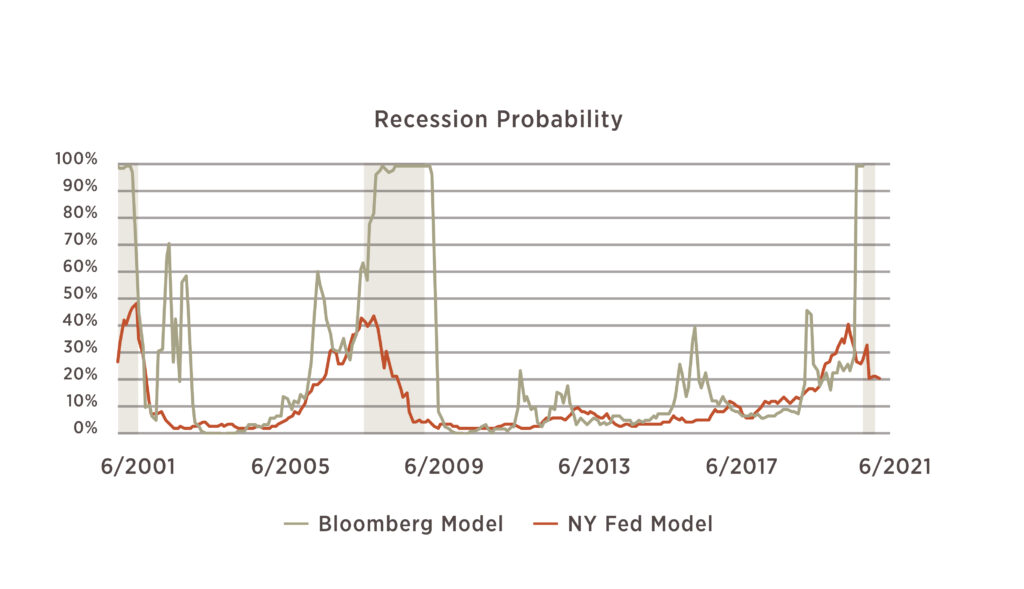
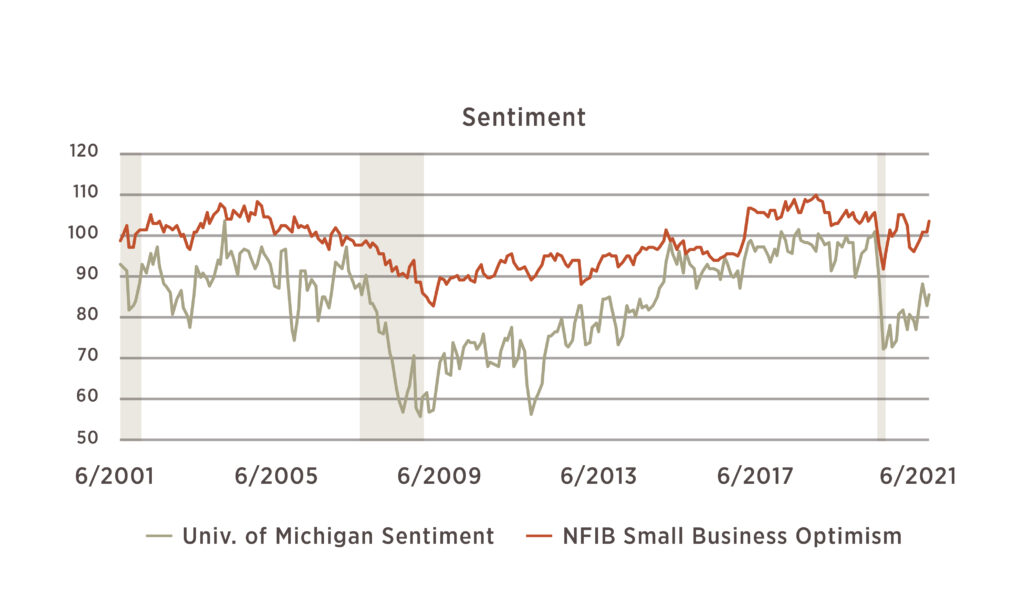
Leading indicators, which we use to gauge expectations of future economic activity, have also pulled back slightly after showing record rates of improvement earlier in the year. The Chicago Business Indicator, which gauges business activity and investment intentions, remained strong at 66.1 this month (readings above 50 indicate expansion). The index of leading indicators also remained strong, posting a 12% improvement from the levels of last summer. Measures of both consumer and business sentiment also showed improvement throughout the quarter despite concerns over price pressures.
Equity Market Valuations
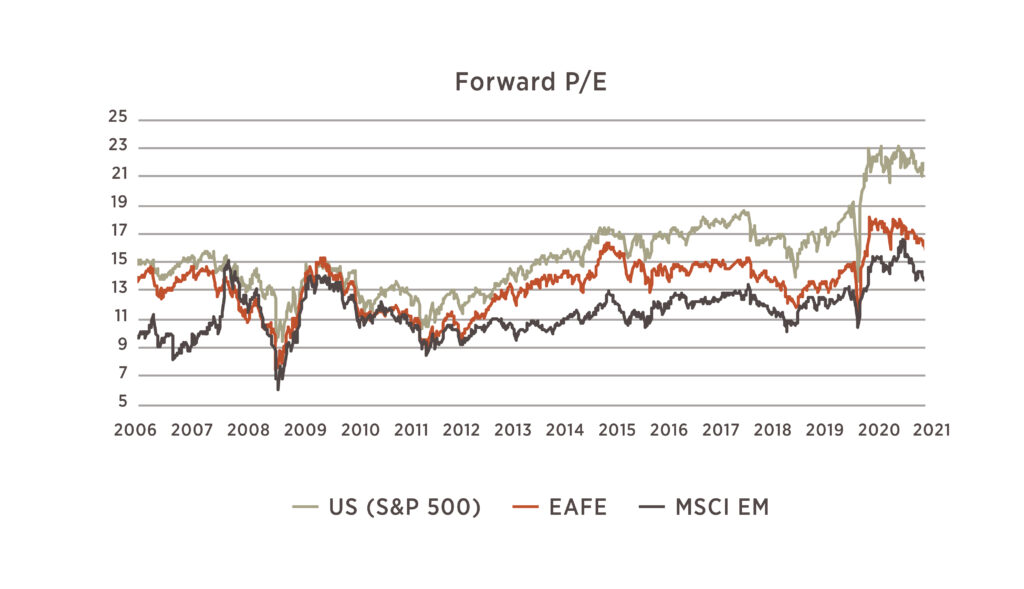
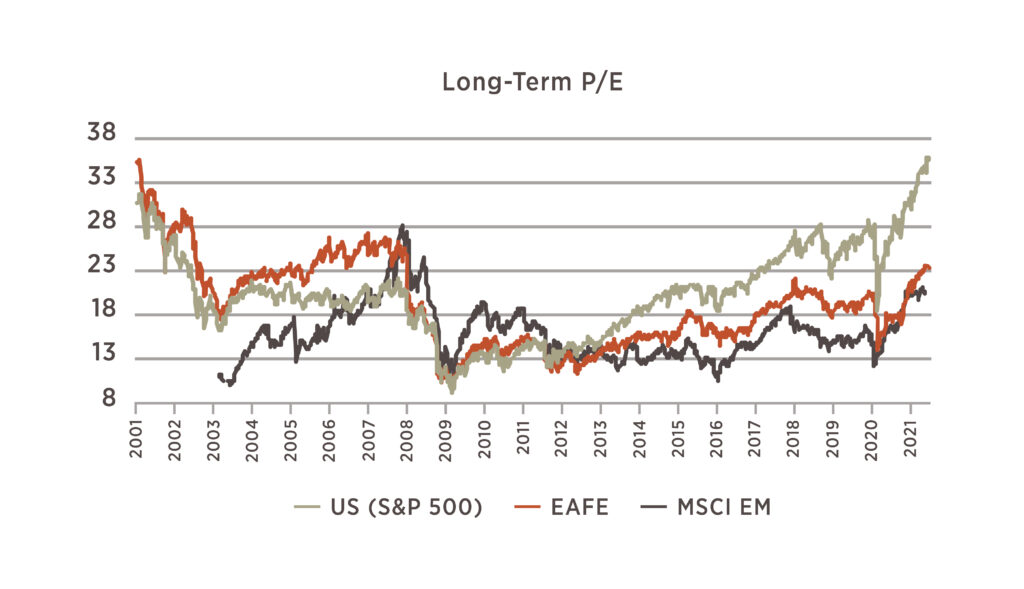
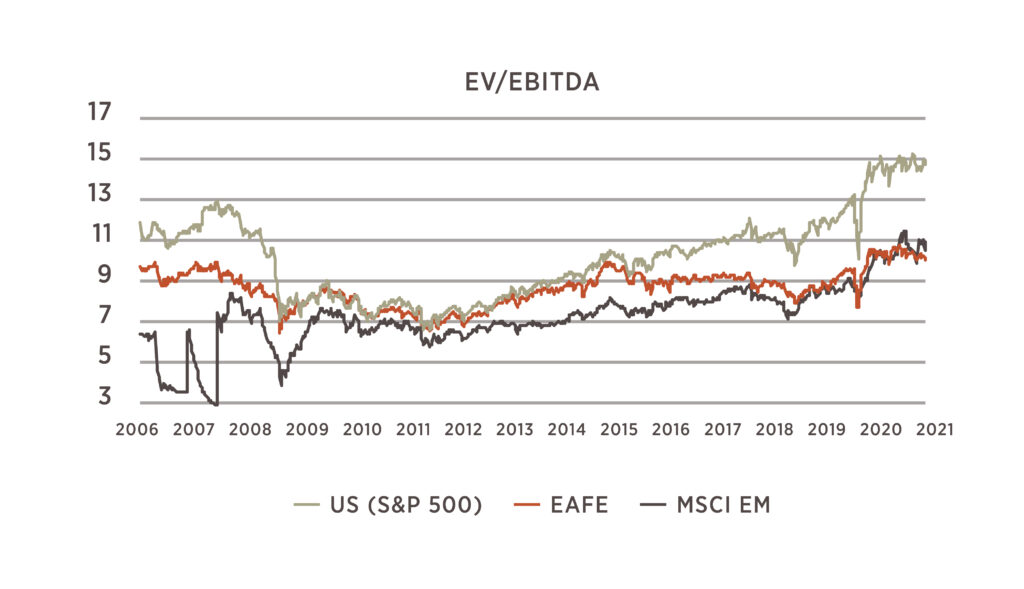
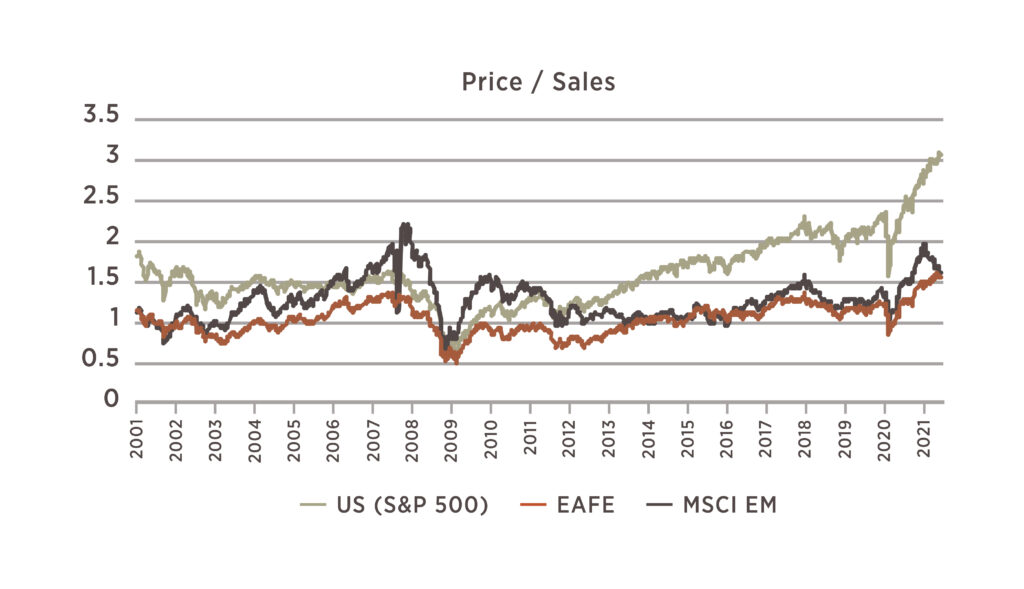
We include several measures of valuation for stock markets to get a more thorough picture than any one measure would provide. Forward looking measures such as Forward P/E and EV / EBITDA have begun to stabilize in the US and decline outright in non-US markets due to continued improvement in earnings and expectations. However, valuations and the spread between US and non-US markets remain historically high. While these ratios may not revert fully back to their average levels, it is unlikely that they will continue to expand indefinitely. Given the maturing of the new economic cycle we expect multiples to compress from here, meaning the market may struggle to make new highs even as earnings continue their growth trajectory.
Fixed Income
In fixed income markets, the US Treasury yield curve has declined as expectations for both inflation and growth have been tempered. The 10-year yield now sits at 1.3%, which is a drop of 0.4% from the peak earlier this year. Corporate spreads, representing the additional yield offered to take on corporate credit risk, have continued to come down to historically low levels. Spreads on investment grade bonds remain near their lowest point in the past ten years. High yield spreads – including the BB and B rated bonds on this chart – remain wider but have also continued to compress. Investors seeking yield within fixed income are left with few good options without taking on substantial credit risk.
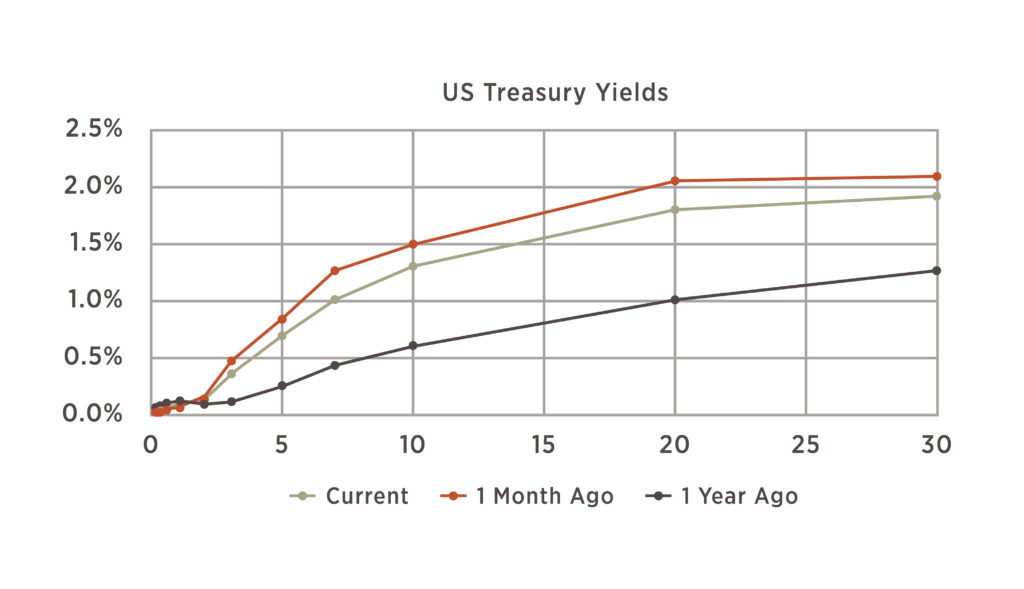
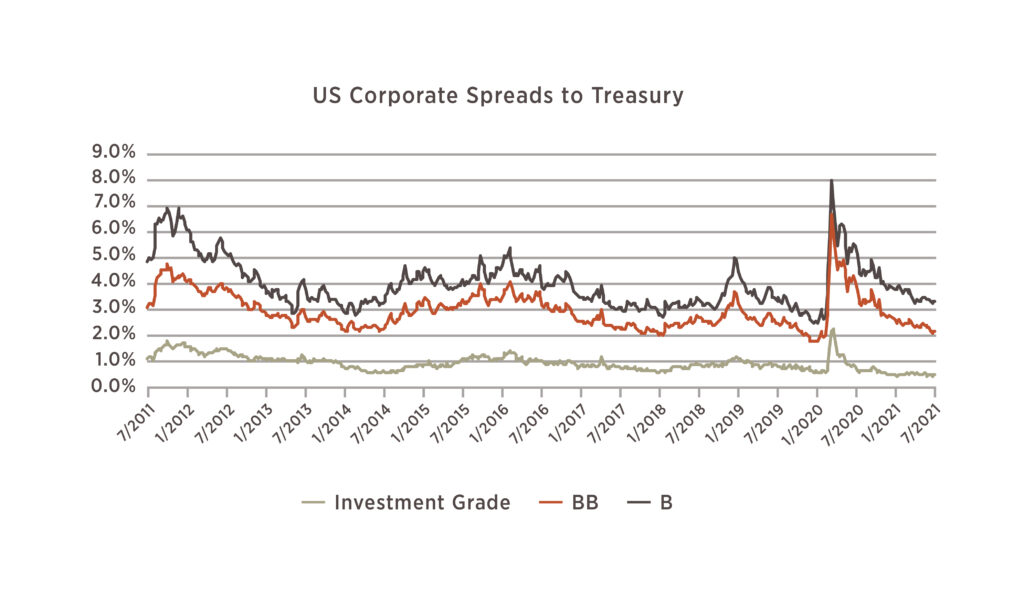
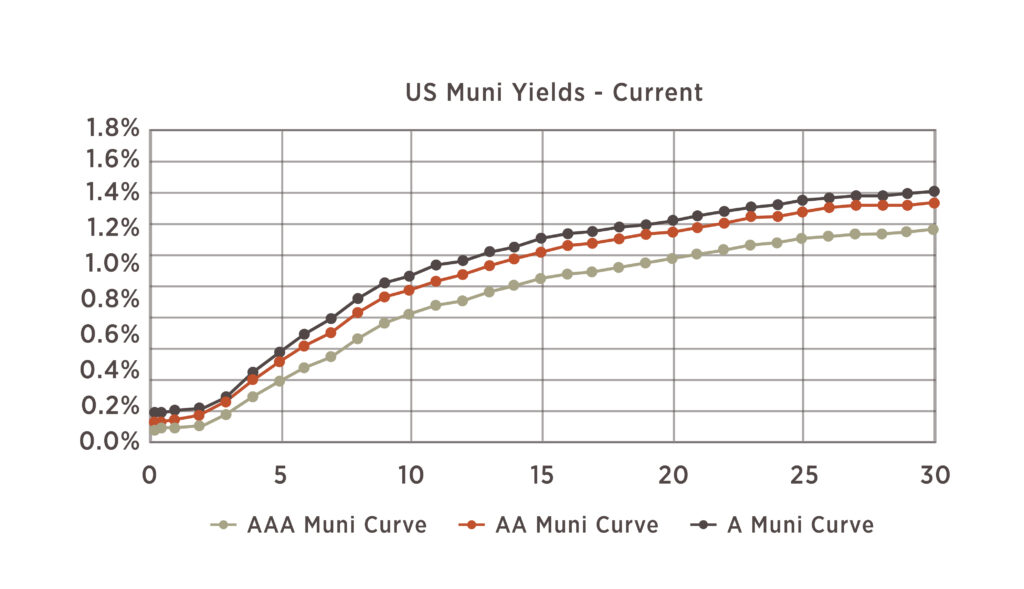
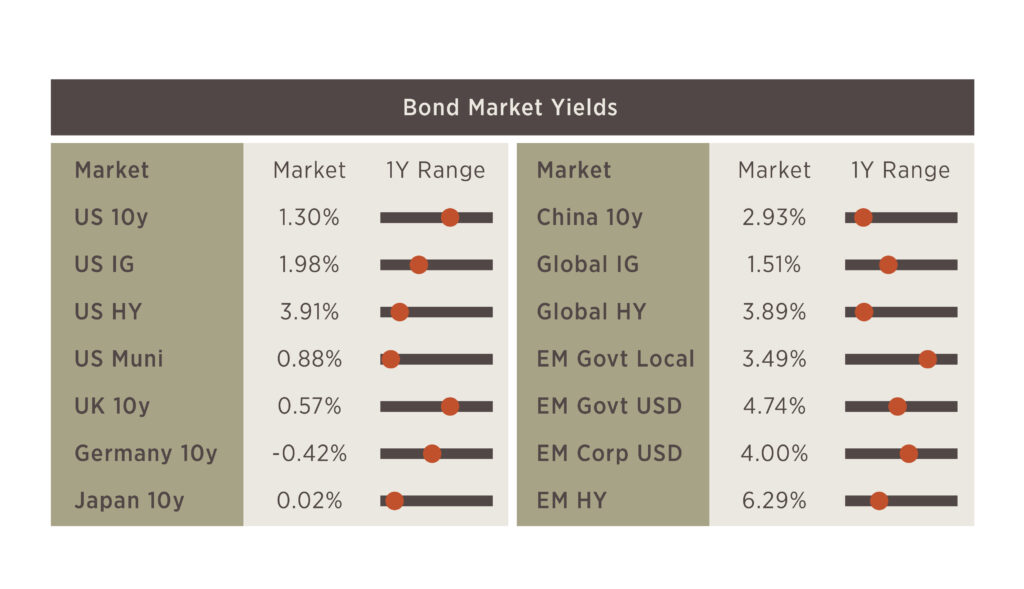
Source for all graphs: Bloomberg 2021, Analysis by 6 Meridian
The information and data contained in this report are from sources considered reliable, but their accuracy and completeness is not guaranteed. This material has been prepared solely for informational purposes only and is not an offer to buy or sell or a solicitation of any offer to buy or sell any security or other financial instrument, or to participate in any trading strategy.
Securities offered by Registered Representatives through Private Client Services, Member FINRA/SIPC. Advisory products and services offered by Investment Advisory Representatives through 6 Meridian LLC, a Registered Investment Advisor. Private Client Services and 6 Meridian LLC are unaffiliated entities.
Investors cannot invest directly in an index and unmanaged index returns do not reflect any fees, expenses or sales charges.
Past performance is no guarantee of future returns. Investing involves risk and possible loss of principal capital. No advice may be rendered by 6 Meridian LLC unless a client service agreement is in place.


