There is no single indicator that can tell us how best to invest. However, we find it is vital to keep pace with economic and market data that show what current and potential future trends are taking shape. To do this, we look at signals from equity and fixed income markets as well as from the real economy.
Here are some of the indicators we use to map out where the economy and markets may be headed.
Economy
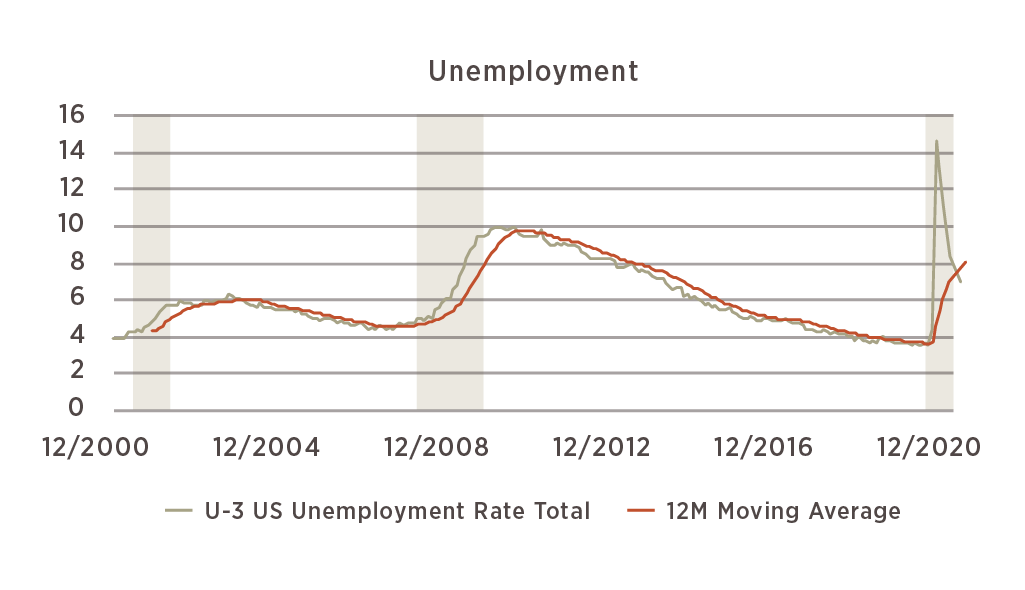
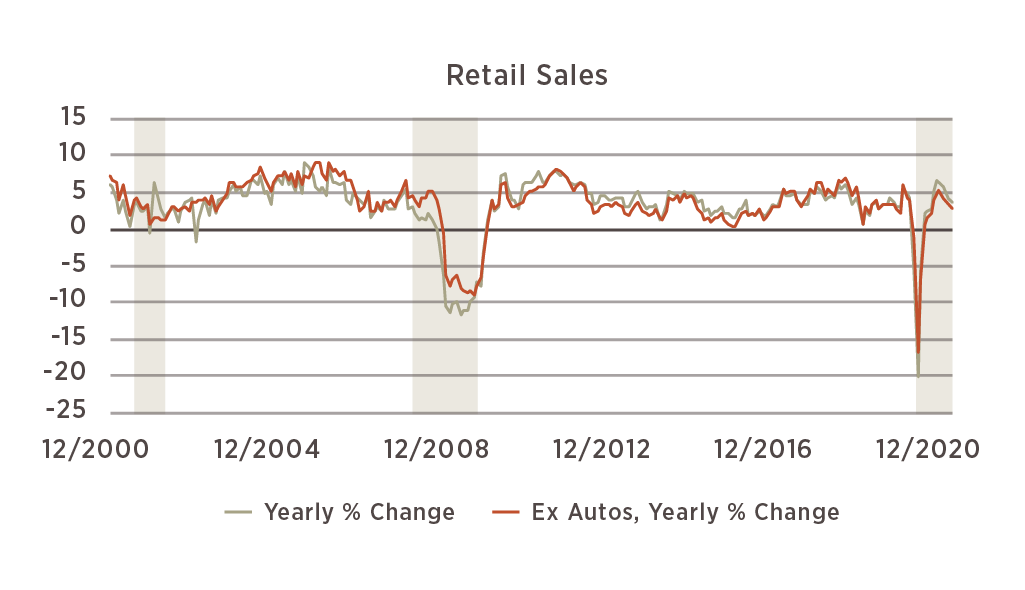
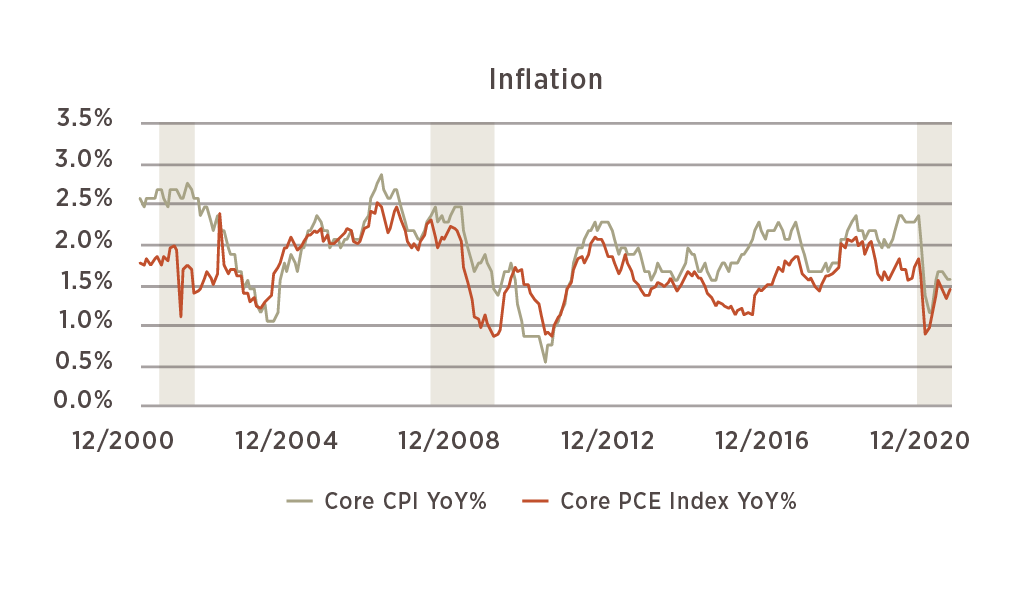
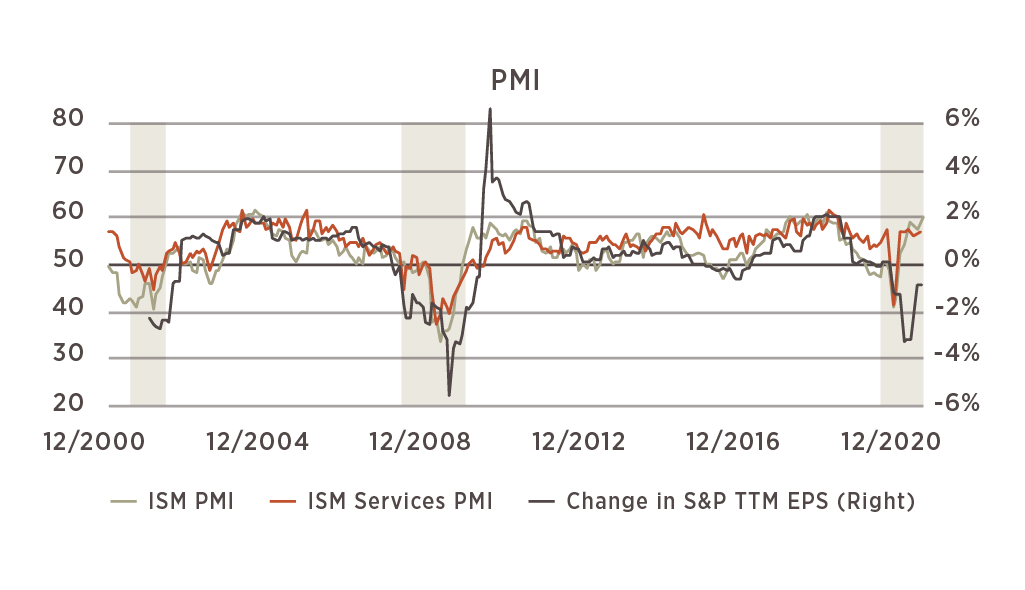
In the fourth quarter of the year, current indicators showed a slowdown in the pace of economic recovery. Unemployment remained stuck at 6.7%, while growth in retail sales slowed to 1.1%. Inflation held steady, with the CPI showing a 1.6% year-over-year increase in prices. Both the manufacturing and services PMI indicators continued to climb – to 60.5 and 57.7, respectively. The gain represents a continued pickup in business activity, as levels above 50 for these indicators reflect expansion. This could bode well for S&P 500 earnings as we move through the 4th quarter reporting season.
Forward Indicators
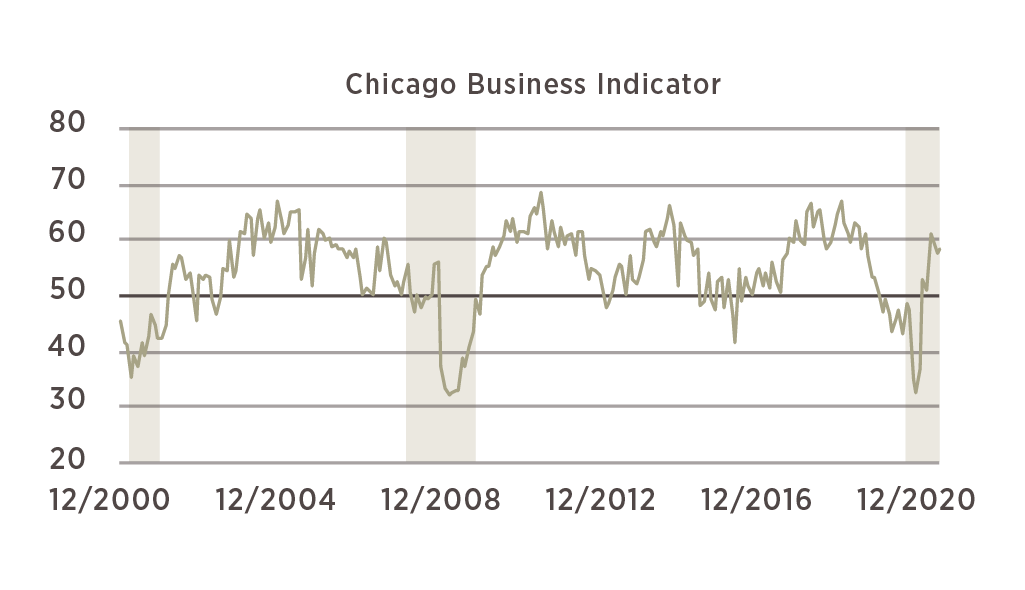
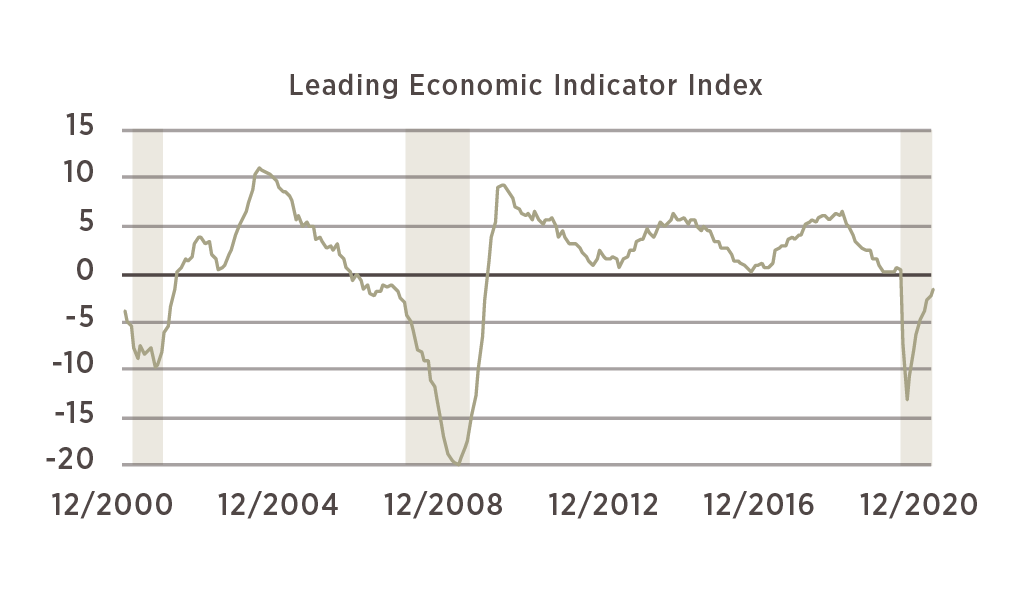
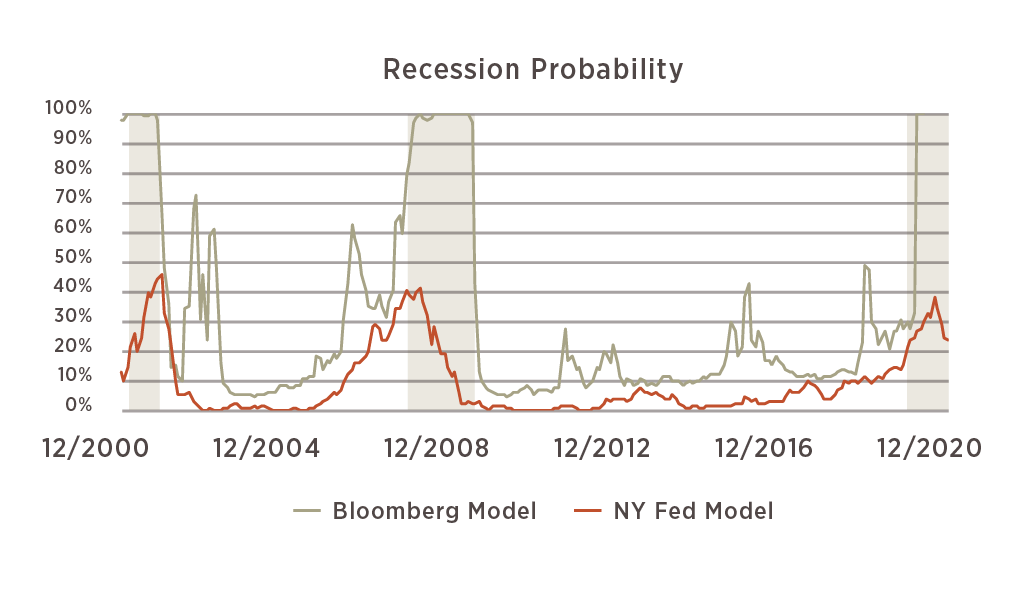
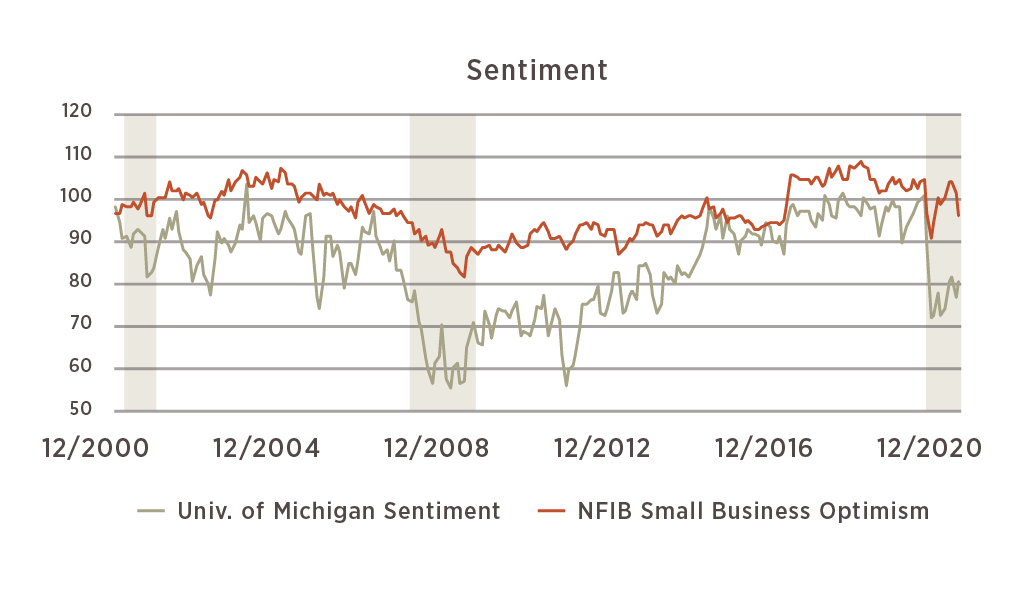
Leading indicators, which we use to gauge expectations of future economic activity, are beginning to show improvement as well. The Chicago Business Indicator, which gauges business activity and investment intentions, held at 58.7 this month (readings above 50 indicate expansion). The index of leading indicators, while still negative, continued to improve month-over-month. While small business sentiment declined somewhat, consumer sentiment continued to improve off of its low base.
Equity Market Valuations
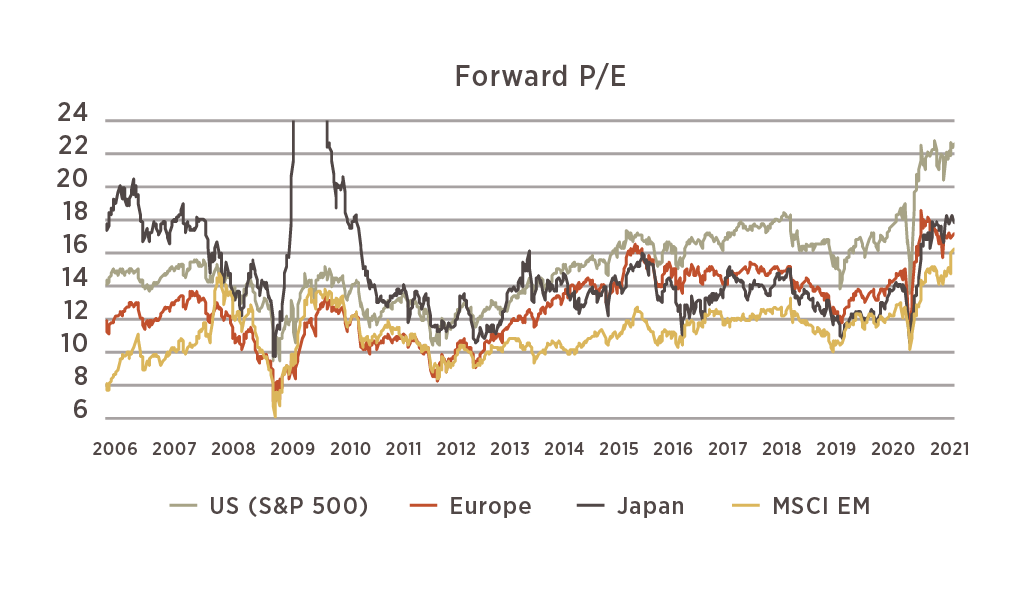
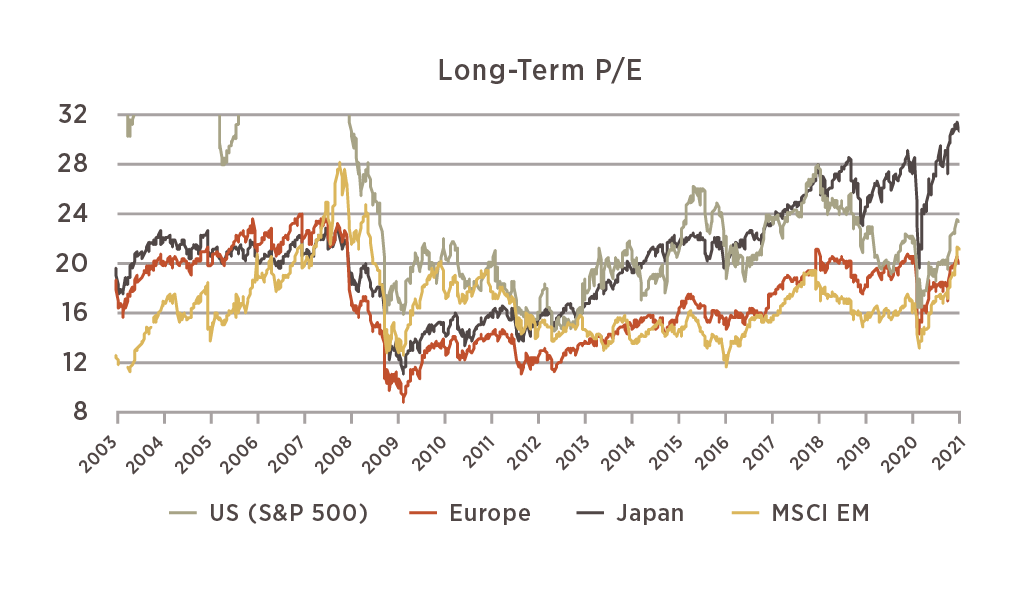
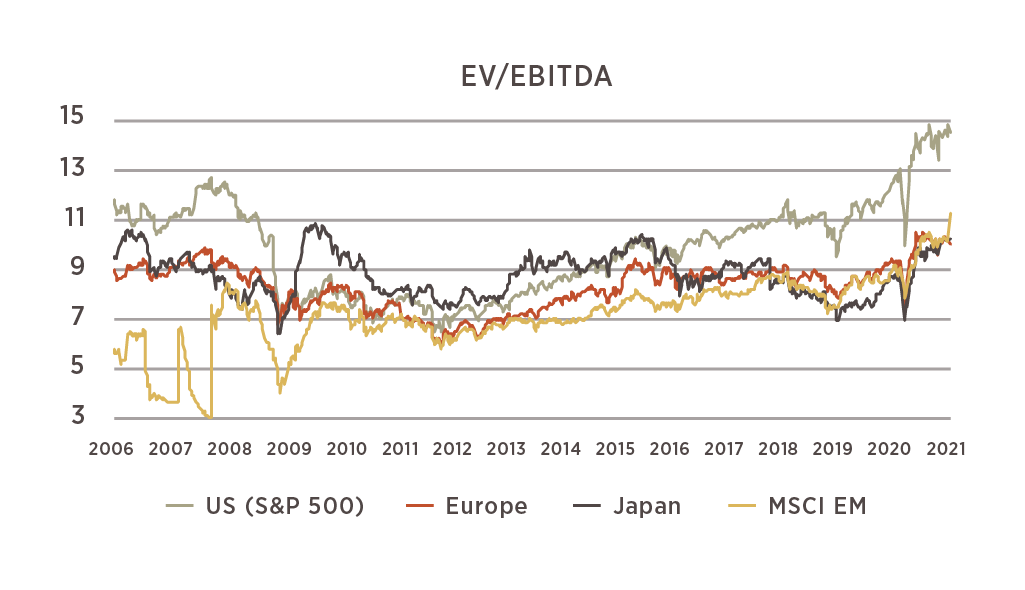
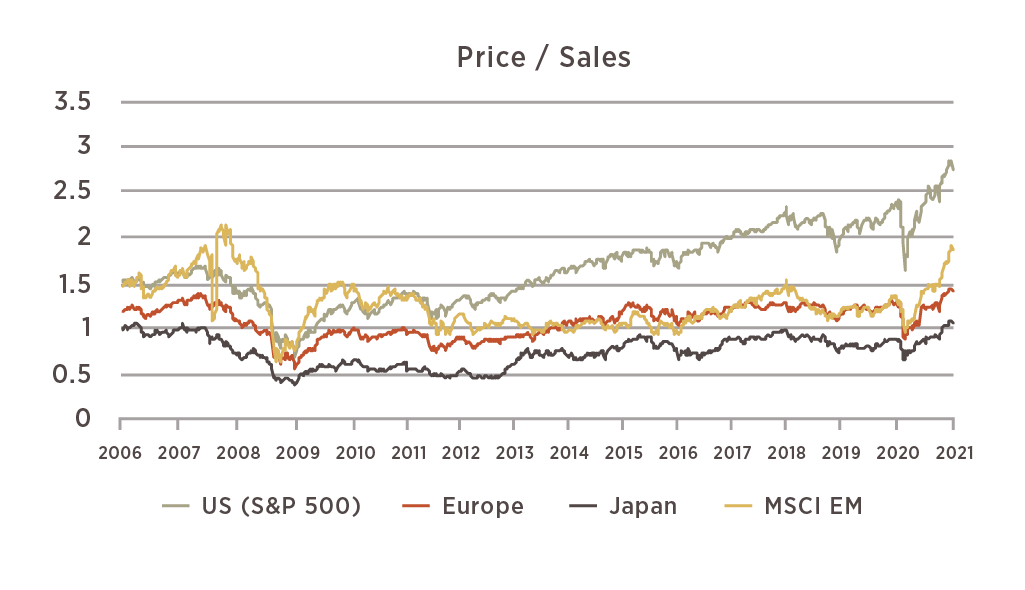
We include several measures of valuation for stock markets to get a more thorough picture than any one measure would provide. Currently these measures are all telling the same story – US stocks look very expensive relative to their history and relative to non-US markets, especially after the recent upward move in prices. While these ratios may not revert fully back to historically normal levels, it is unlikely that they will continue to expand indefinitely. In the last few months, valuations for non-US markets have also climbed as price gains in those markets outpaced the S&P 500 Index. For the most part, however, valuations in non-US markets are still more reasonable than those in the US.
Fixed Income
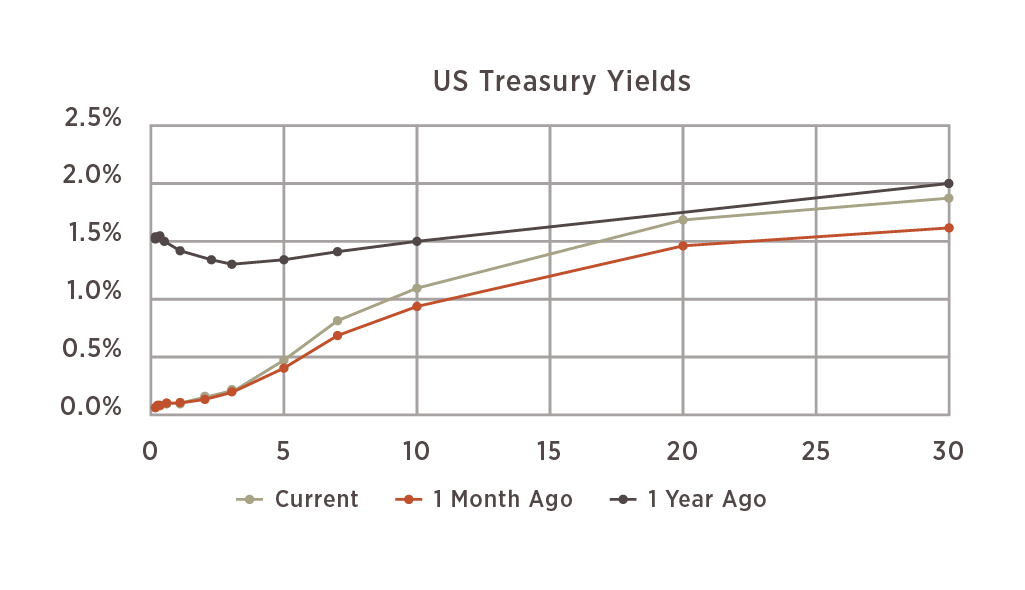
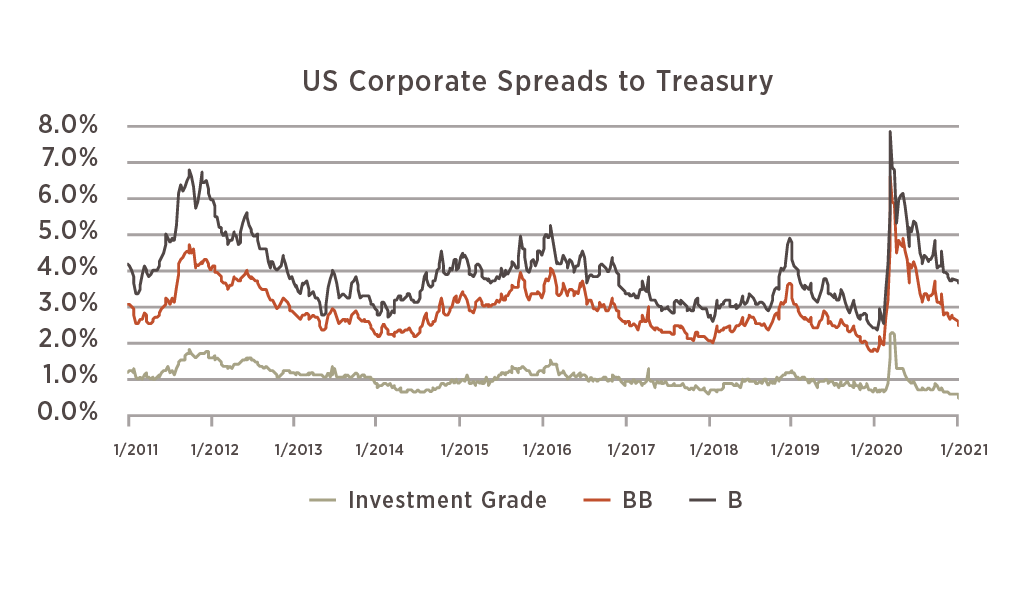
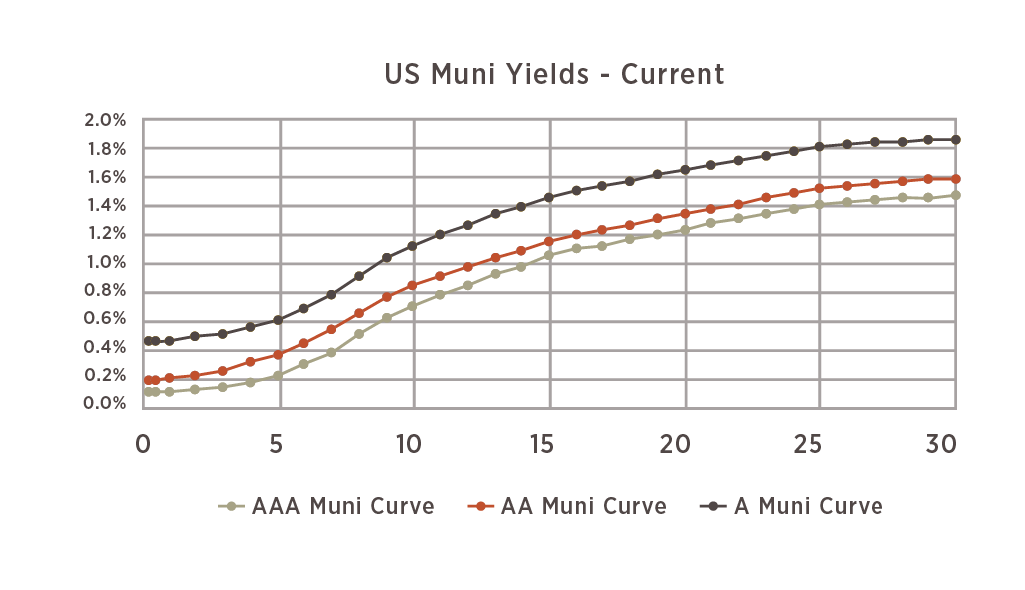
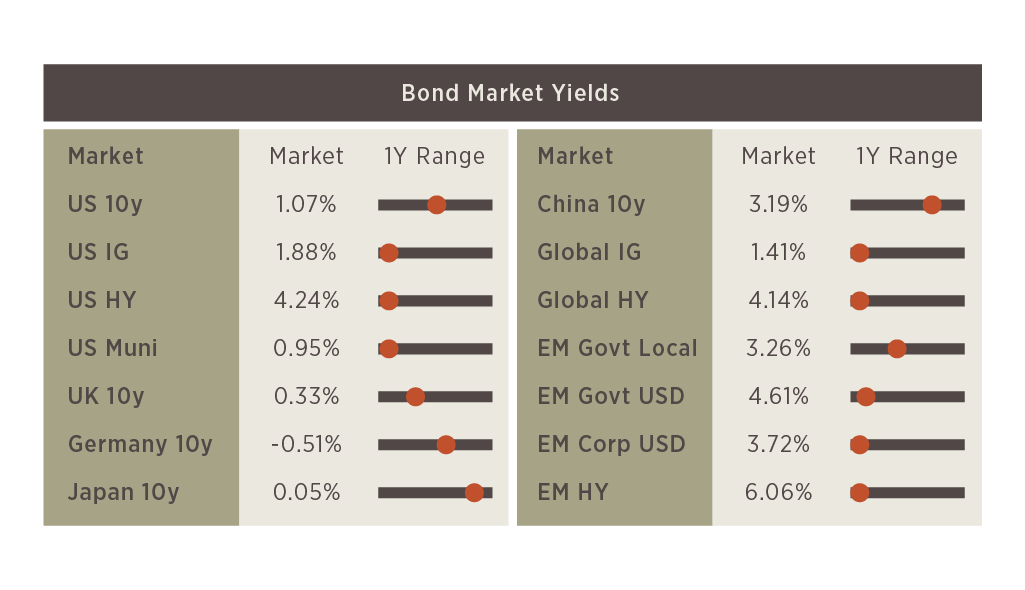
Looking at fixed income markets, the US Treasury yield curve has steepened as longer dated yields rose throughout the month. The 10-year yield now sits at 1.08%, which is still low in historical terms but notably higher than the levels we saw through most of 2020. Corporate spreads, representing the additional yield offered to take on corporate credit risk, have continued to come down to historically low levels. Spreads on investment grade bonds are not only narrower than they were in 2019, they are around the lowest point in the past ten years. High yield spreads – including the BB and B rated bonds on this chart – remain wider, but this also reflects a high level of continuing uncertainty around potential defaults and bankruptcies from high yield issuers. Investors seeking yield within fixed income have flocked to corporate bonds as yields everywhere have come down and the Fed has indicated support for the space. That means today’s yields on corporates leave very little upside and very little compensation for the risk involved.
Source for all graphs: Bloomberg 2021, Analysis by 6 Meridian
The information and data contained in this report are from sources considered reliable, but their accuracy and completeness is not guaranteed. This material has been prepared solely for informational purposes only and is not an offer to buy or sell or a solicitation of any offer to buy or sell any security or other financial instrument, or to participate in any trading strategy.
Securities offered by Registered Representatives through Private Client Services, Member FINRA/SIPC. Advisory products and services offered by Investment Advisory Representatives through 6 Meridian LLC, a Registered Investment Advisor. Private Client Services and 6 Meridian LLC are unaffiliated entities.
Investors cannot invest directly in an index and unmanaged index returns do not reflect any fees, expenses or sales charges.
Past performance is no guarantee of future returns. Investing involves risk and possible loss of principal capital. No advice may be rendered by 6 Meridian LLC unless a client service agreement is in place.


