Chart of the Month

With football season upon us, we can now all spend the next 5-6 months cheering on our favorite teams while also being the best armchair referees the game has known. From a fan perspective, we get to sit back on the couch and make judgments on the calls the “live” referees are making – and we get to do so with the benefit of replay on every single play – “The call was obvious – how could anyone possibly have missed it!” Well, fortunately as fans, they instituted rules that can help rectify the “obvious” errors via instant replay, slow-motion, and zoom functionality!
With investing, we have the same ability to look back at historical results, kind of like instant replay, but unlike football, we can’t make corrections. We always see best in hindsight and we can often articulate in our minds that we should have known certain things were going to occur once they did, in fact, happen. But does it really do any good?
We like to make comparisons, whether that be with different parts of the market or with our neighbors, but are those comparisons being done with the end objective in mind? Is the objective to build wealth quickly and with volatility, or by following a long-term plan that builds more slowly and sustainably to meet the end objectives?
We have spoken in the past about the instantaneous nature of our society today and the constant need for quick gratification. But we believe investing should be viewed differently – by building a plan and sticking to it for whatever time horizon best suits one’s current and future wants or needs. Whether the 6-month, 1-year, or even 5-year performance of one’s portfolio is poor relative to some opportunity that is now seen with 100% clarity in hindsight should be irrelevant. What is relevant is whether that performance over longer time horizons is keeping you and your goals on track.
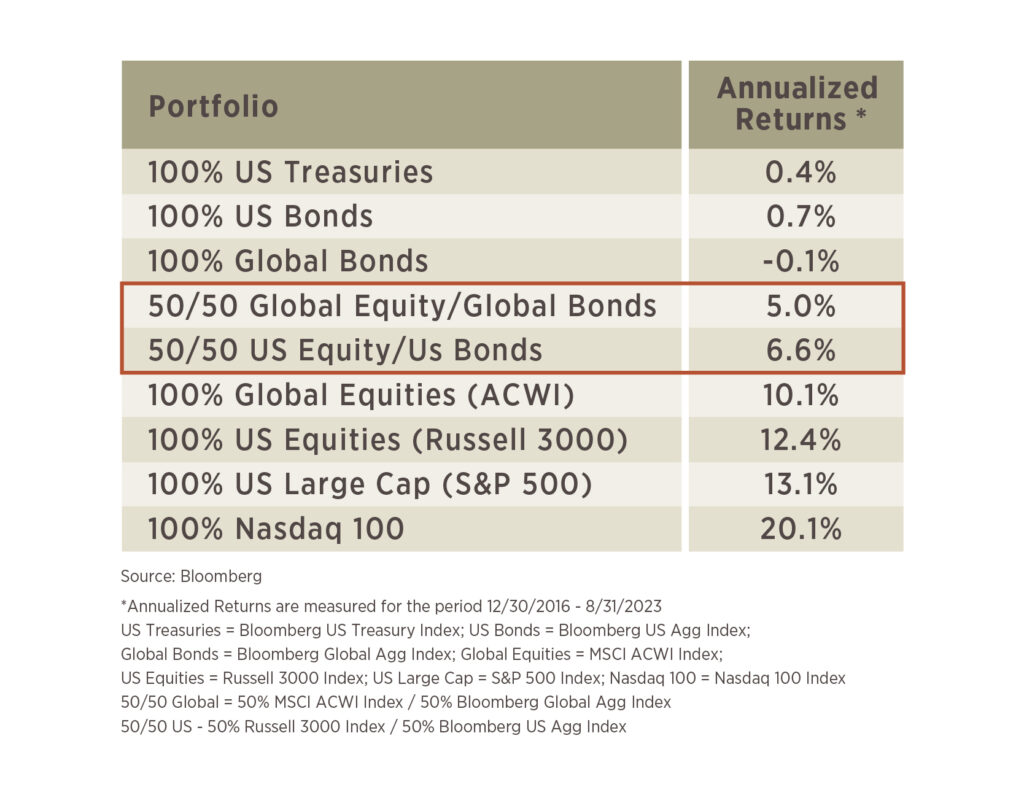
The table illustrates a historical review of the past 6-7 years to show what could have been… These returns assume (1) you paid for no advice, (2) never took out one penny and reinvested all interest/dividends, and (3) never panicked during any of the major drawdowns: 2018 sell-off, COVID, or 2022 bear market.
We know most investors were probably not 100% allocated to any one asset, but nevertheless, the options did exist. The downside is that a 100% allocation to one individual market carries a lot of risk. It is more likely that investors are better represented by the 50/50 portfolios that diversify risk while keeping long term goals in perspective. While not as much fun to talk about, the question you should ask is “did the results align with what my plan called for?” Are you still on track to reach your goals, even if you don’t have bragging rights on owning the hottest portfolio on the street? If that is the case, we think you are winning the long game in setting yourself up for the future.


First introduced in 1978 by sportswriter Leonard Koppett, The Super Bowl Indicator is a theory that a Super Bowl win for a team from the American Football Conference (AFL) foretells a decline in the stock market that upcoming year, whereas a win for a team from the NFL’s National Football Conference (NFC) means the stock market will rise in the coming year.
It initially appeared to have a high success rate, with over 90% accuracy before the dotcom years. As of the end of 2022, the indicator has been correct 41 out of 56 times, or approximately 73%, but there have been significant instances where it failed to accurately predict market trends. Experts do emphasize that this correlation does not imply causation, so while the Super Bowl Indicator remains a fun and lighthearted topic of discussion, often making headlines each year around the Super Bowl and football season, it lacks any scientific basis, and its predictions should not be taken seriously for making investment decisions. See where the indicator was right and wrong at: investopedia.com/terms/s/superbowlindicator.asp.

