In this 3-part blog series, our investment management team provides research into the possible benefits of using multi-factor modeling to create investment strategies. Our first post will look at the definition of the factors and how tracking error impacts this type of strategy. The second post will dive in a bit further to look at each of the 5 factors both individually and collectively. Our final post will tie together all these elements to complete the story of utilizing multi-factor modeling.
#1) The Factors and Tracking Error Defined
Most investors say they have a long investment horizon but often still focus on performance over a shorter time period of months or quarters. In an instantaneous world with CNBC blaring the latest headlines it can be hard to focus on longer investment timelines. It is easy to get sucked into a FOMO (fear of missing out) mindset. This is how bubbles can form.
From an investment lens, it is difficult to ignore the constant visual of how markets and personal investments have performed as it’s often readily available at our fingertips. This makes it difficult to zoom out and focus on the bigger picture while making it easy to get sucked into short-term movements even in the face of big risks.
With this in mind, one measure we would like to present is ‘tracking error’ (or active risk). In its simplest terms, tracking error shows the variation in returns of one’s portfolio relative to a benchmark. Put another way, it shows how much one should expect their portfolio’s performance to deviate from a benchmark in any given year.
For example, if the benchmark index has an average historical return of 8% and your portfolio has a tracking error to this index of 5% that means that two-thirds of the time, your portfolio will have a return within 5% of the benchmark return (between 3% – 13%). Of course that also means that one-third of the time, your portfolio will have a return variance greater than 5%.
To illustrate this concept in practice, we have created a portfolio of 5 equally-weighted factors. This strategy is well-known throughout the industry and includes ample academic research supporting its use in constructing a portfolio. The securities underlying each factor, as defined below, are drawn from the largest 100 companies in the U.S.
Those factors used for illustrative purposes are:
- Low Beta: Companies that move less than the market.
- High Momentum: Companies that have performed well will likely continue to do so.
- Value: Companies whose price relative to what they earn is low.
- Yield: Companies that distribute a larger quantity of cash flows to their investors relative to their current price.
- Quality: Companies that exhibit superior profitability
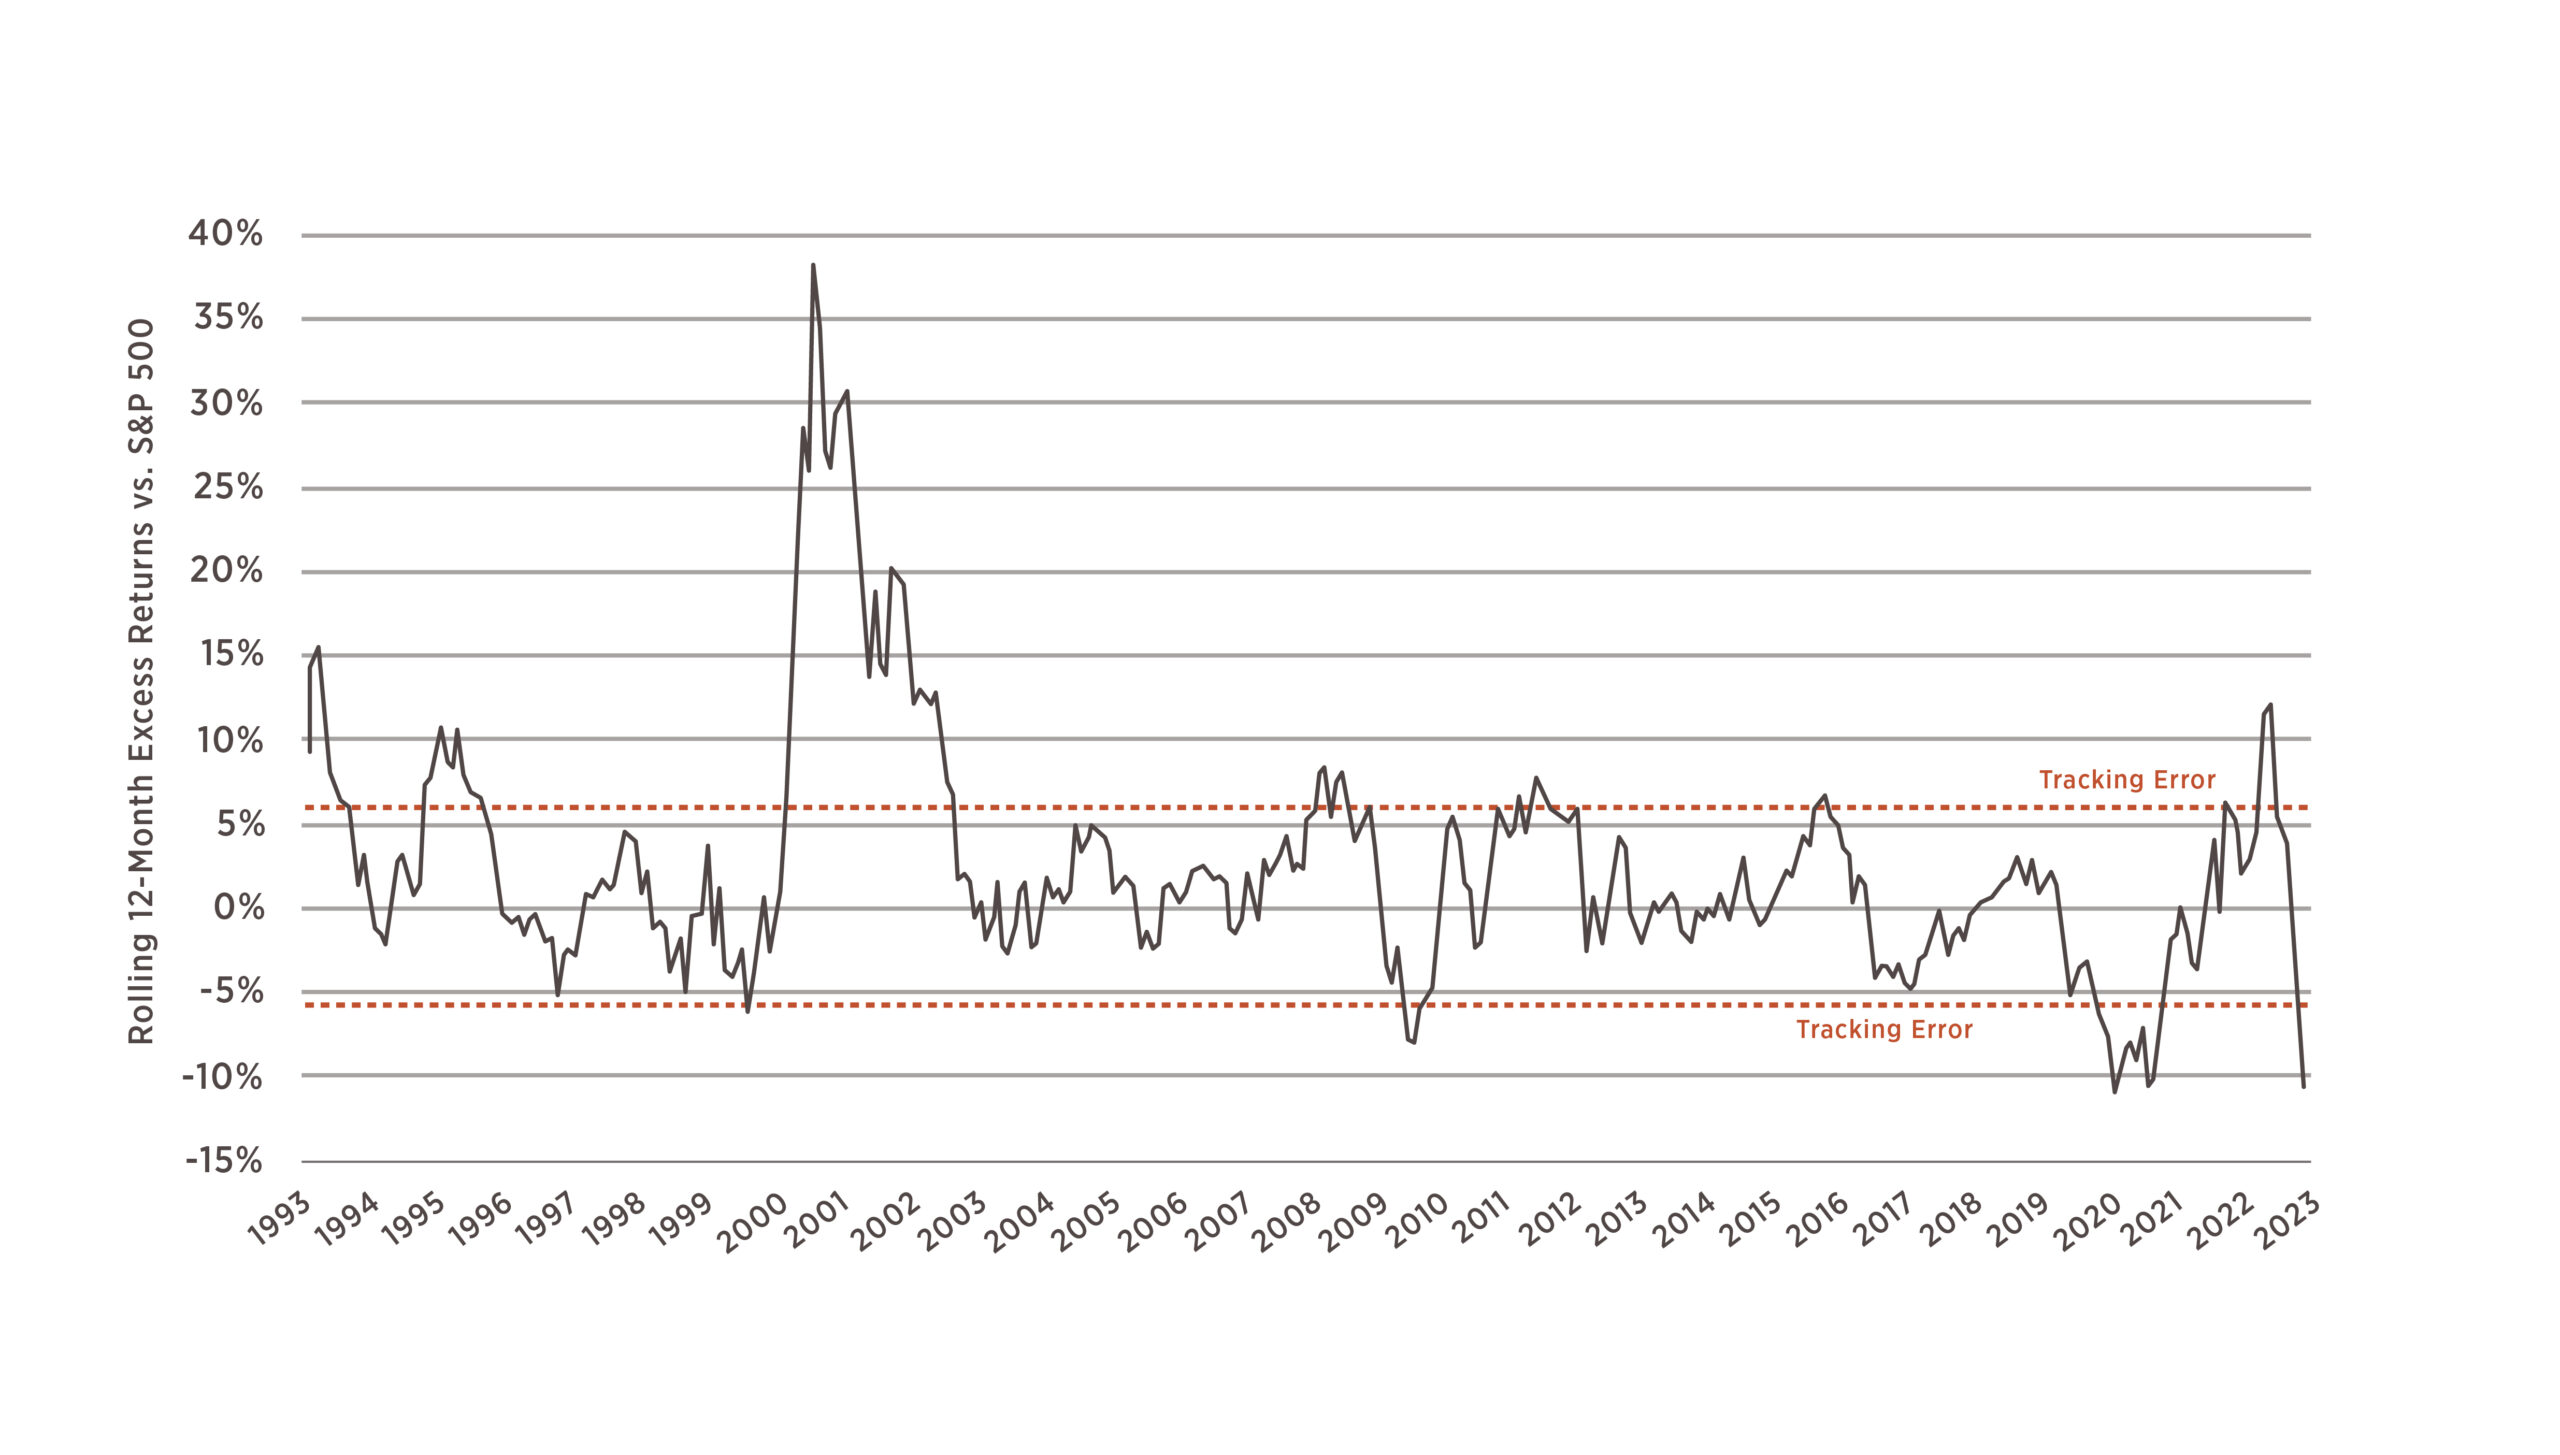
Universe used to measure factor exposures is the S&P 100 Index. The 5 Factor Portfolio is equally-weighted with semi-annual rebalancing. Graphic represents the excess returns of the 5 Factor Portfolio against the S&P 500 Index on a rolling 12-month basis
The dotted lines illustrate the tracking error band in which we would reasonably expect about 2/3 of all annual returns to fall. As noted, anything above 0% means the 5-factor portfolio outperformed the benchmark over that 12-month period and anything below 0% was underperformance. What is peculiar about today is that the 5-factor portfolio is well outside of the tracking error band and thus represents performance that is historically more of an outlier – a similar event occurred during the COVID market in 2020.
Why does this matter? If you look at returns in any given year and are constantly comparing them to the benchmark, there will be instances where you feel really good and some where you don’t. With a portfolio that has high levels of tracking error, one should expect large deviations in the short term. However, as we hope to illustrate in the forthcoming blog posts, tracking error over long investing horizons should be tolerated because, without it, there is no means of generating excess returns for the risks being taken.
Next up, we are going to look at how each of the 5 factors we used for this illustration individually have large tracking errors, but when combined, can be supportive in reducing the overall portfolio’s level of deviation from its benchmark. Plus, you will not want to miss why, as an investor, you might consider seeking alpha.
July 28, 2023
Andrew Mies, CFA
Jason Mayers, CFA
The investment strategy presented may not be suitable for all investors. Please contact your financial advisor and review important disclosures before making any investment decisions.