In this 3-part blog series, our investment management team provides research into the possible benefits of using multi-factor modeling to create investment strategies. Our first post will look at the definition of the factors and how tracking error impacts this type of strategy. The second post will dive in a bit further to look at each of the 5 factors both individually and collectively. Our final post will tie together all these elements to complete the story of utilizing multi-factor modeling.
#2) The 5 Factors: Individually vs Collectively
In our last blog post, we focused on understanding what tracking error means to an investor in his/her portfolio and illustrated how a portfolio of 5-Factors can deviate materially from the broader market in any given 12-month window. What we are going to show in this post is how combining that group of factors is beneficial from a portfolio risk-reduction perspective.
This table shows the individual tracking error against the S&P 500 for each of the 5 Factors we monitor. Clearly, at the single-factor level, each tracking error is higher than the portfolio combined. This is not a magic trick, but a result of combining factors that do not all move in unison. Some zig while others zag. This is due to the diversifying nature of combining factors.
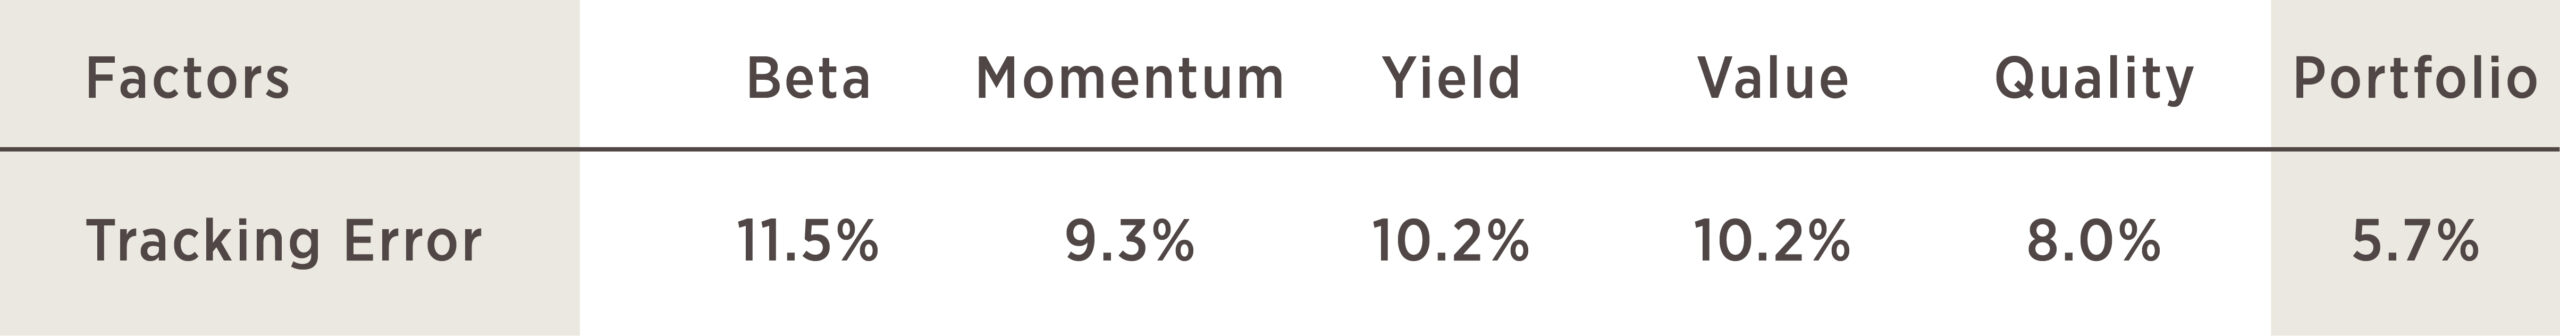
Universe used to measure factor exposures is the S&P 100 Index. The 5 Factor Portfolio is equally-weighted with semi-annual rebalancing. Tracking Error = Standard Deviation of Excess Returns
For math junkies, we’ve included the correlation table below to illustrate that the different factors vary with one another but, by and large, have higher levels of correlation to the S&P 500. This matters for diversification of risk and diversification simply comes by combining characteristics that are not perfectly correlated with one another (meaning a correlation of +1).
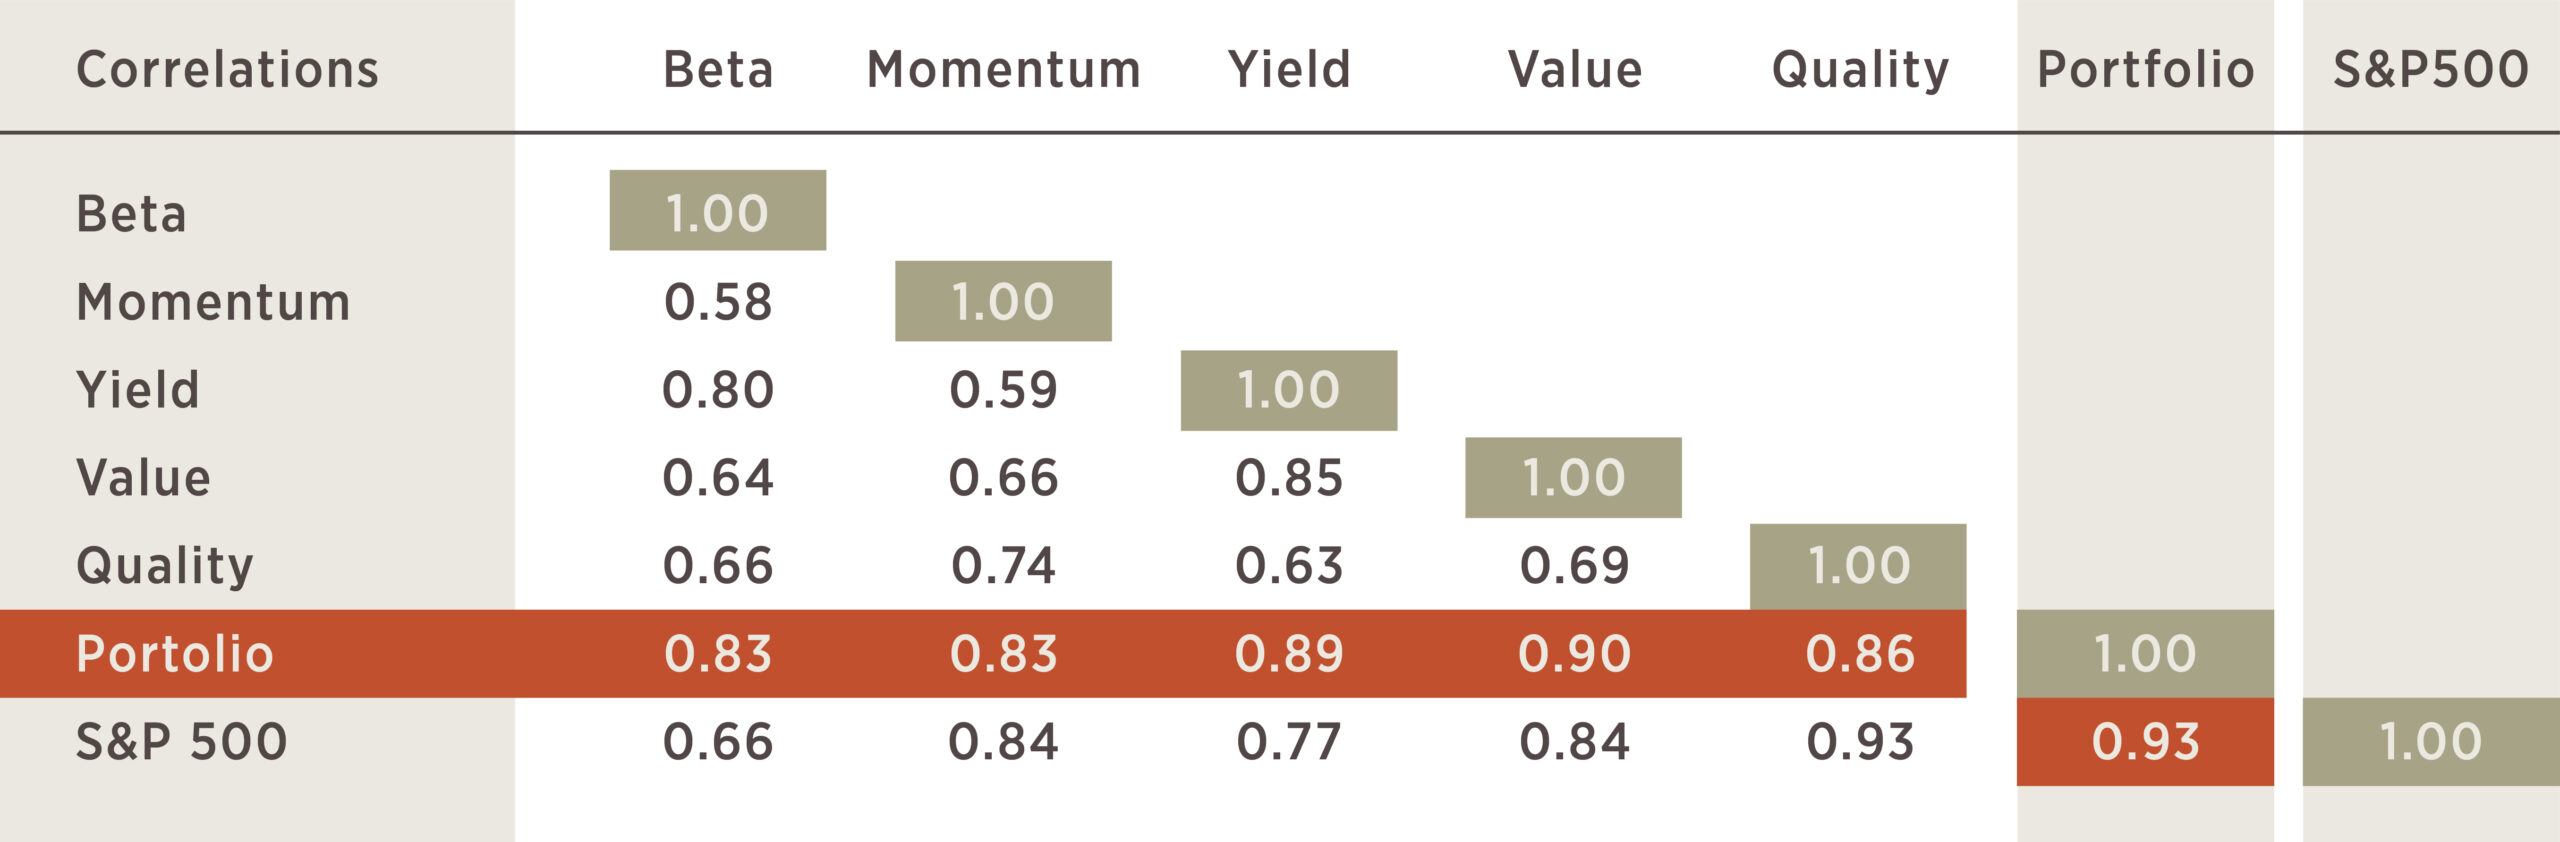
Universe used to measure factor exposures is the S&P 100 Index. The 5 Factor Portfolio is equally-weighted with semi-annual rebalancing.
In effect, by combining these characteristics, the portfolio’s risk has been reduced. If it is challenging to stomach returns that could be 5-6% away from the benchmark in any given year, try owning a single-factor portfolio that could under- or outperform by 10% or more in a 12-month window!
Why should this amount of tracking error be tolerated? Now we are getting to the good stuff! This table illustrates major risk and return characteristics for each factor, the portfolio combining those factors, and the S&P 500. Without getting too deep into the weeds, what we want to focus on is alpha, or more simply, excess return. All investors would like alpha. It means you are earning more return relative to the risks that are being taken, so positive alpha is good! Over long periods of time, these 5 Factors have all delivered positive alpha, which translates into positive alpha for the portfolio as well. The reason this alpha exists, however, goes back to the willingness of an investor to tolerate short-term fluctuations exhibited by tracking error.
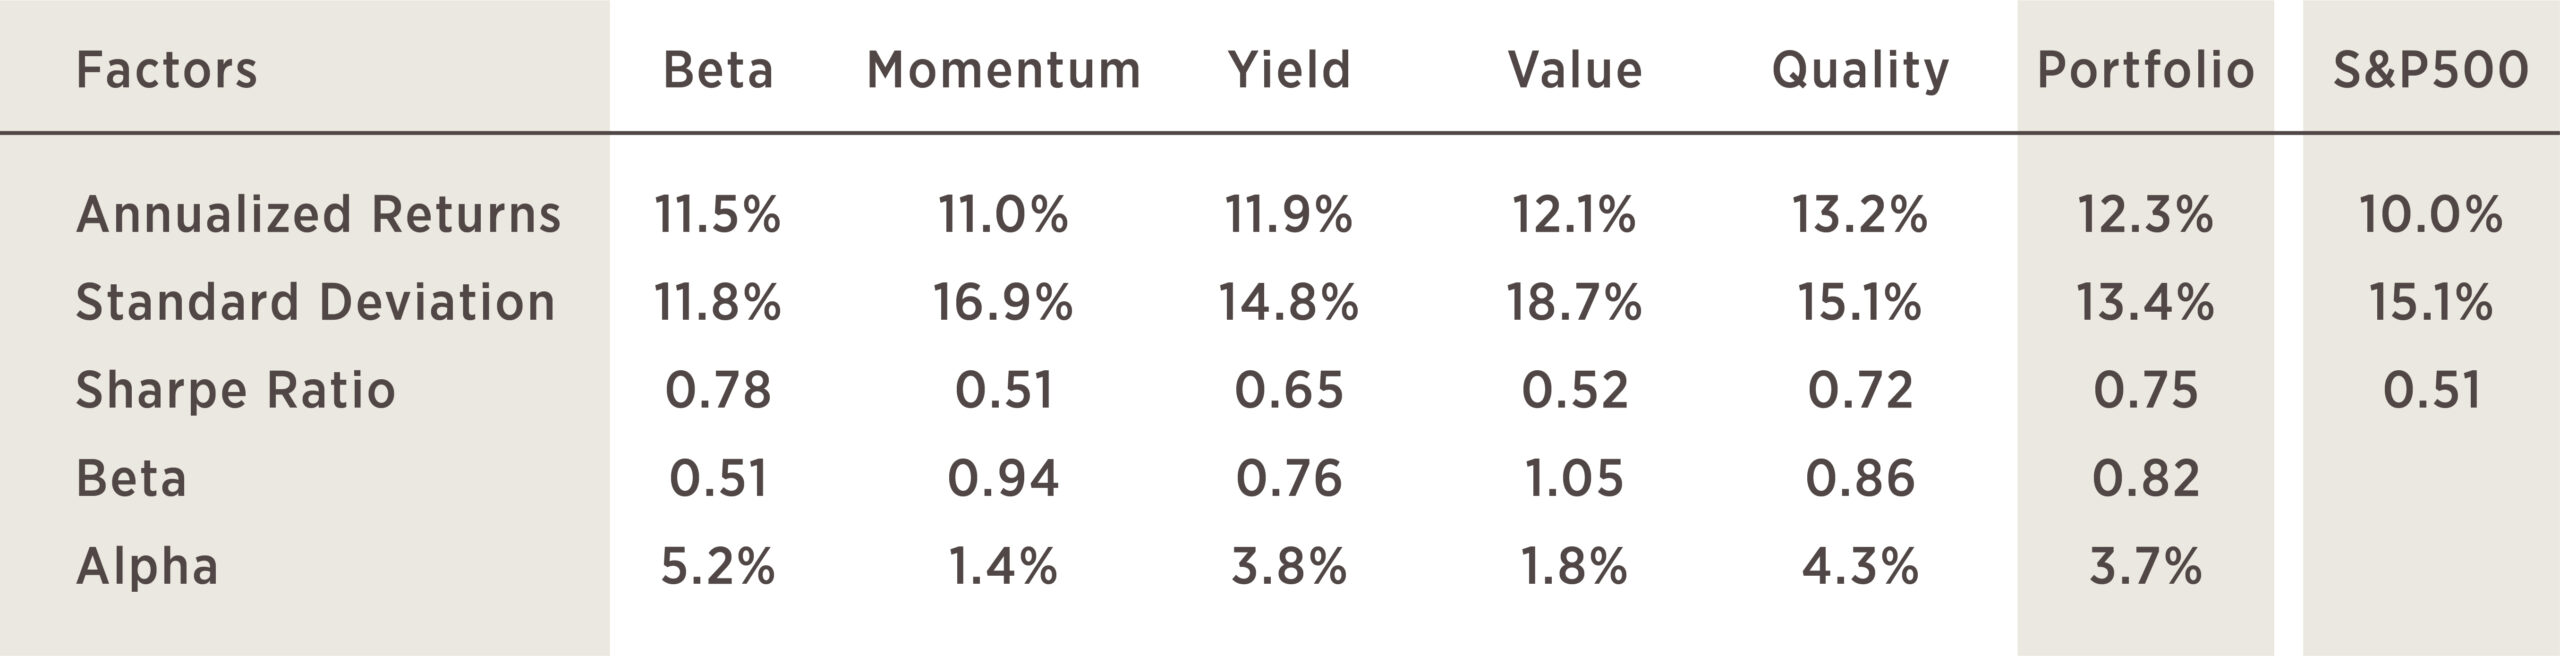
Universe used to measure factor exposures is the S&P 100 Index. The 5 Factor Portfolio is equally-weighted with semi-annual rebalancing. Sharpe Ratio = Factor Annual Return – Risk Free Return / Factor Std. Dev. Alpha = Factor Annualize Return – [Risk Free Return + Factor Beta x (S&P 500 Return – Risk Free Return)]*Risk Free Return is from the 1-3 month Treasury Bill Index from Bloomberg; Annualized Return from June 1993 – June 2023 = 2.3%
This table might raise the question as to why not just own the Low Beta factor, after all, it has generated substantial alpha over the past 30 years! And to that, we point you back to the individual factor tracking errors in which Low Beta over any given 12-month window has substantial deviations from the broader market at 11.5%. For many investors, that level of fluctuation on its own can be challenging to stomach.
In our next post, we will tie all of these elements together. Now that you have digested the appetizer (Blog #1) and main course (Blog #2), it is time for further indulgence and everyone’s favorite – dessert! (Blog #3).
July 28, 2023
Andrew Mies, CFA
Jason Mayers, CFA
The investment strategy presented may not be suitable for all investors. Please contact your financial advisor and review important disclosures before making any investment decisions.