In this 3-part blog series, our investment management team provides research into the possible benefits of using multi-factor modeling to create investment strategies. Our first post will look at the definition of the factors and how tracking error impacts this type of strategy. The second post will dive in a bit further to look at each of the 5 factors both individually and collectively. Our final post will tie together all these elements to complete the story of utilizing multi-factor modeling.
#3) Tying It All Together
We believe that equities, over time, are a great way to create wealth. Exposure to equities can be captured passively – which means you earn the return of the market – or actively. If an investor wants to earn excess return (aka alpha) – he/she needs both a long-time horizon and a willingness to deviate from the market (tracking error). If there is a way to generate alpha and take less risk, we consider that as an attractive opportunity to compound wealth over time.
We believe there are factors in the market that can deliver these results, and the data shown in the prior posts in this series support this conclusion. In the short term, large deviations are to be expected and investors should expect periods of underperformance; however, in the long term, there is opportunity to get paid for the risks being taken.
The last graphs we present show how the portfolio of the 5-Factors would align to the S&P 500 over varying time periods. Anything above or to the left of the diagonal line represents outperformance whereas anything below and to the right is underperformance. Importantly, as the timeframe increases, so too does the frequency of outperformance.
The 5-Factor Portfolio outperforms 60% of the time over 1-year period over the last 360 observations.
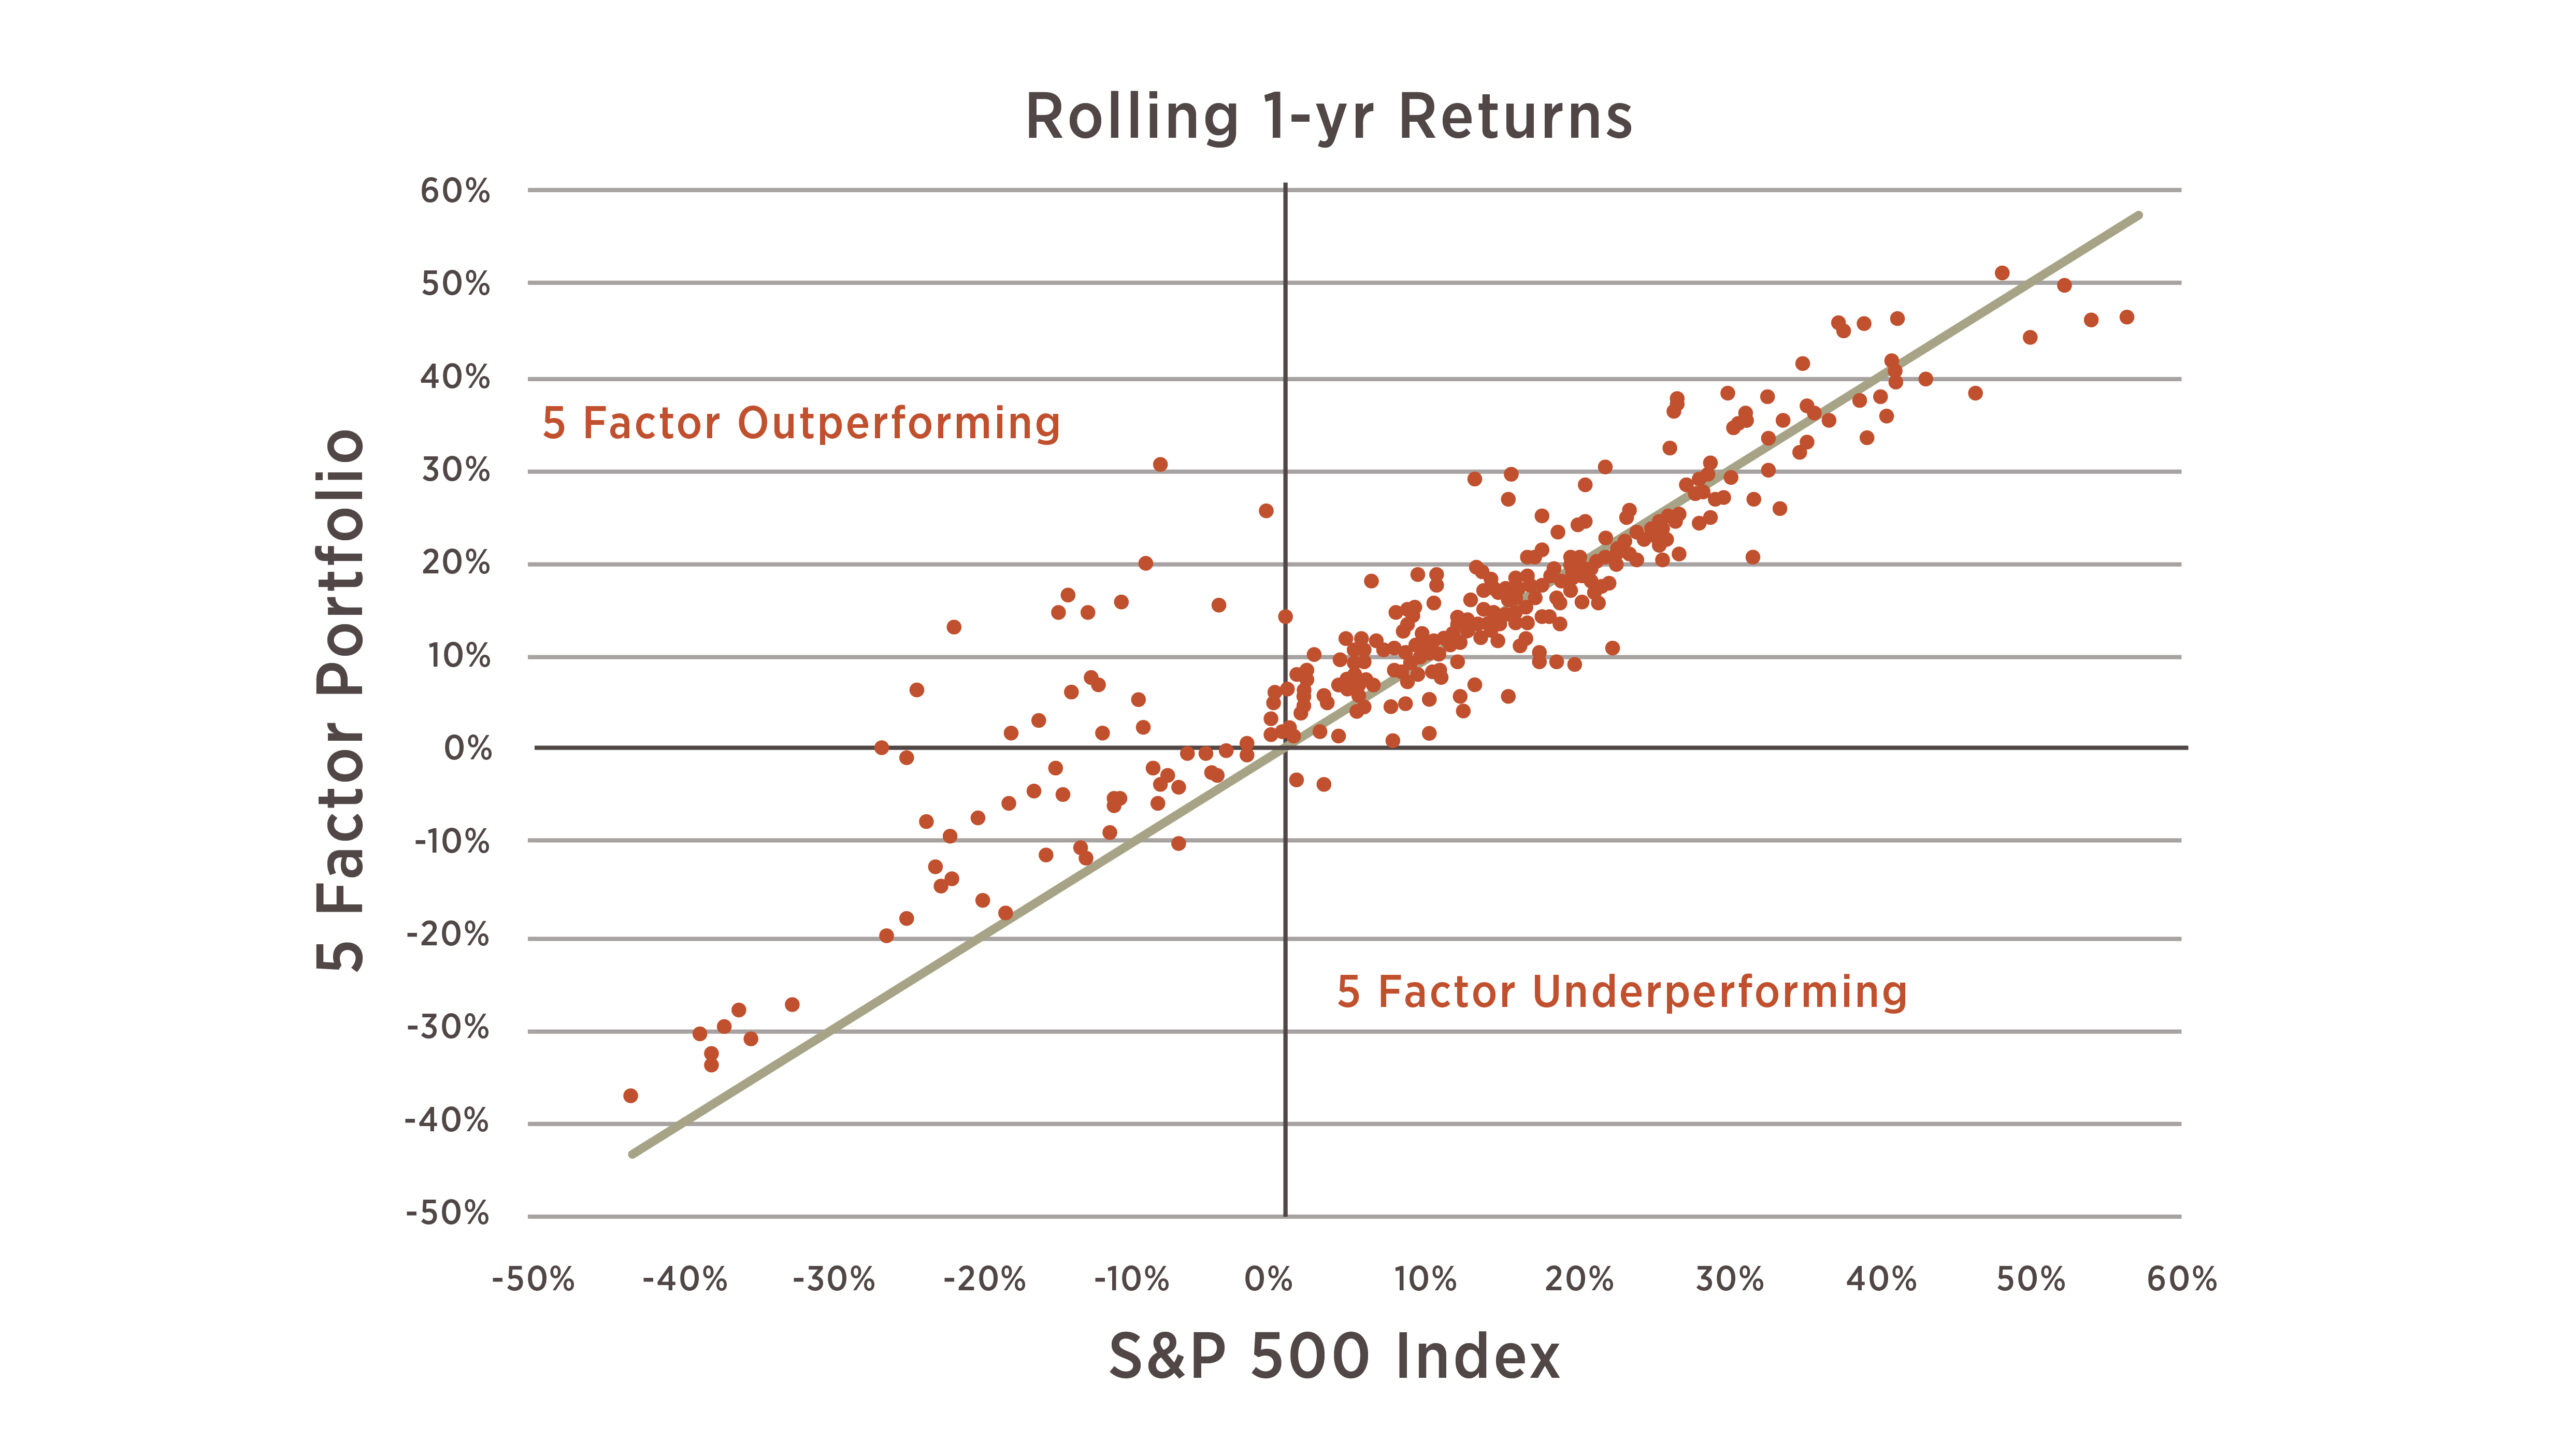
Source: Factset (Jan. 1991 – June 2019) as of June 30, 2019; Bloomberg (July 2019 – June 2023) as of June 30, 2023. Performance reflects backtested data using monthly return data from June 1992 – June 2023; 360 data points for the rolling 1-year performance chart. Information as of June 30, 2023
The 5-Factor Portfolio outperforms 74% of the time over 3-year period over the last 336 observations.
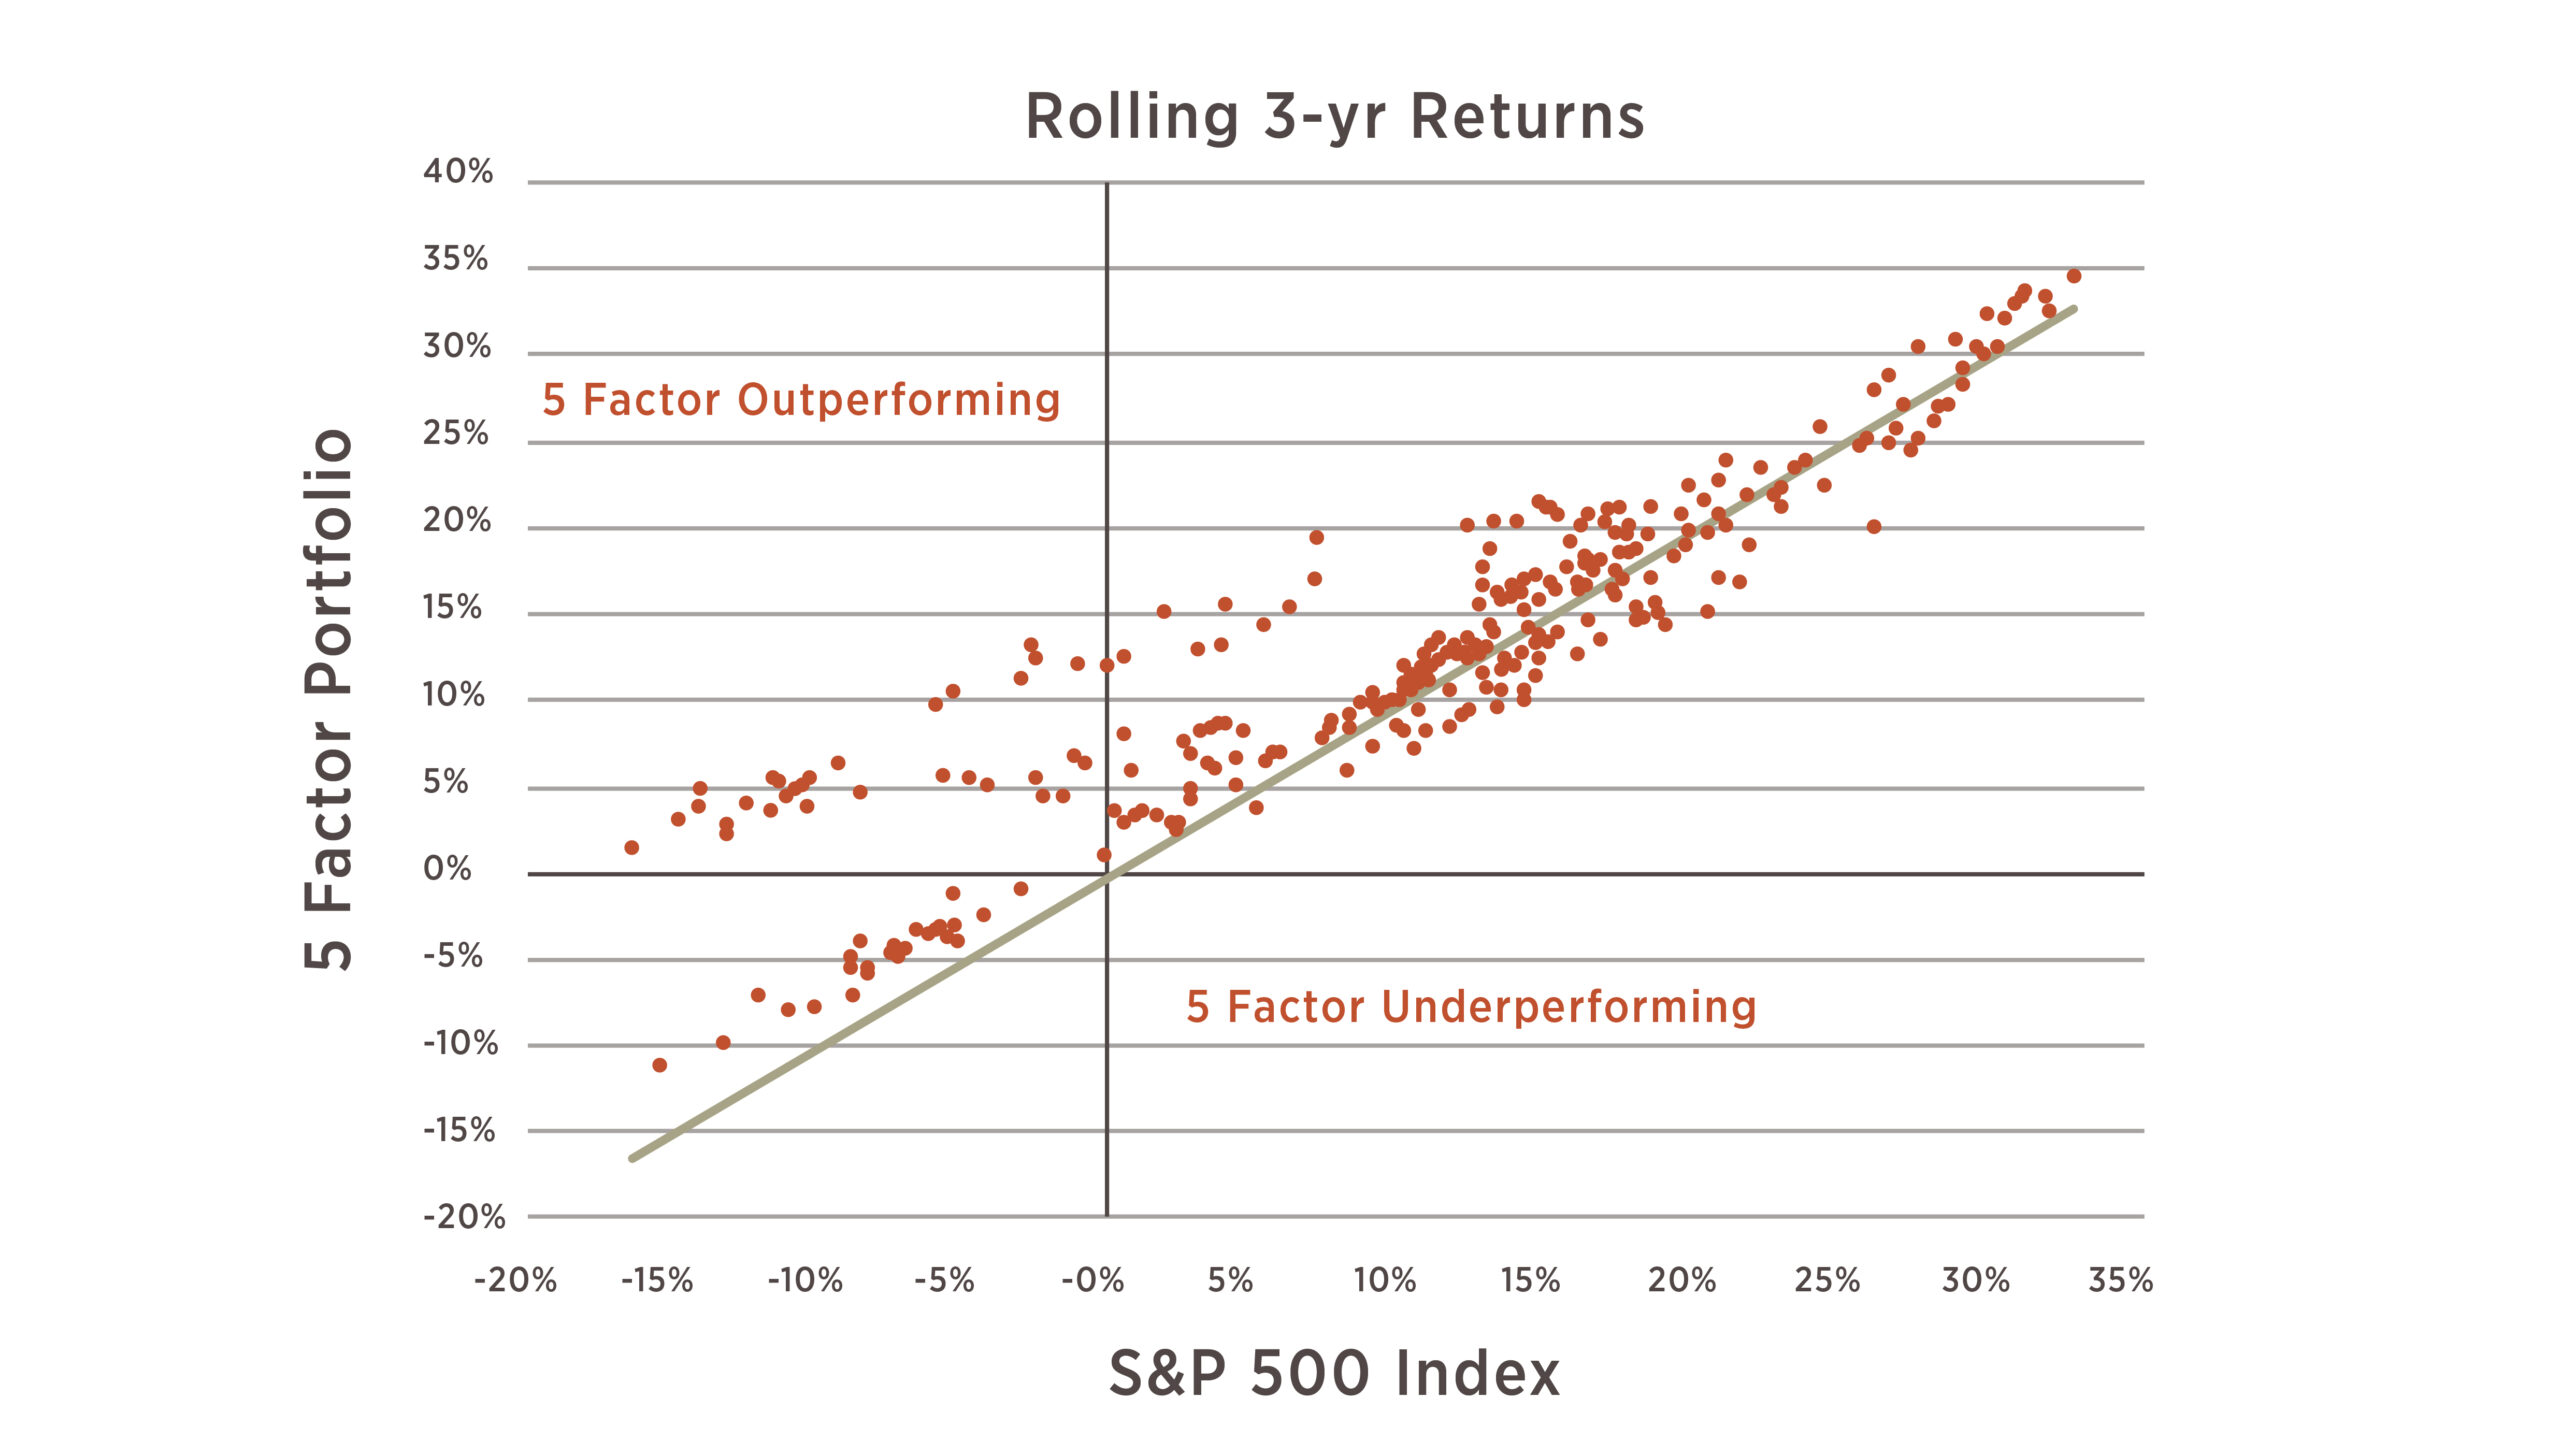
Source: Factset (Jan. 1991 – June 2019) as of June 30, 2019; Bloomberg (July 2019 – June 2023) as of June 30, 2023. Performance reflects backtested data using monthly return data from June 1992 – June 2023;
The 5-Factor Portfolio outperforms 80% of the time over 5-year period over the last 312 observations.
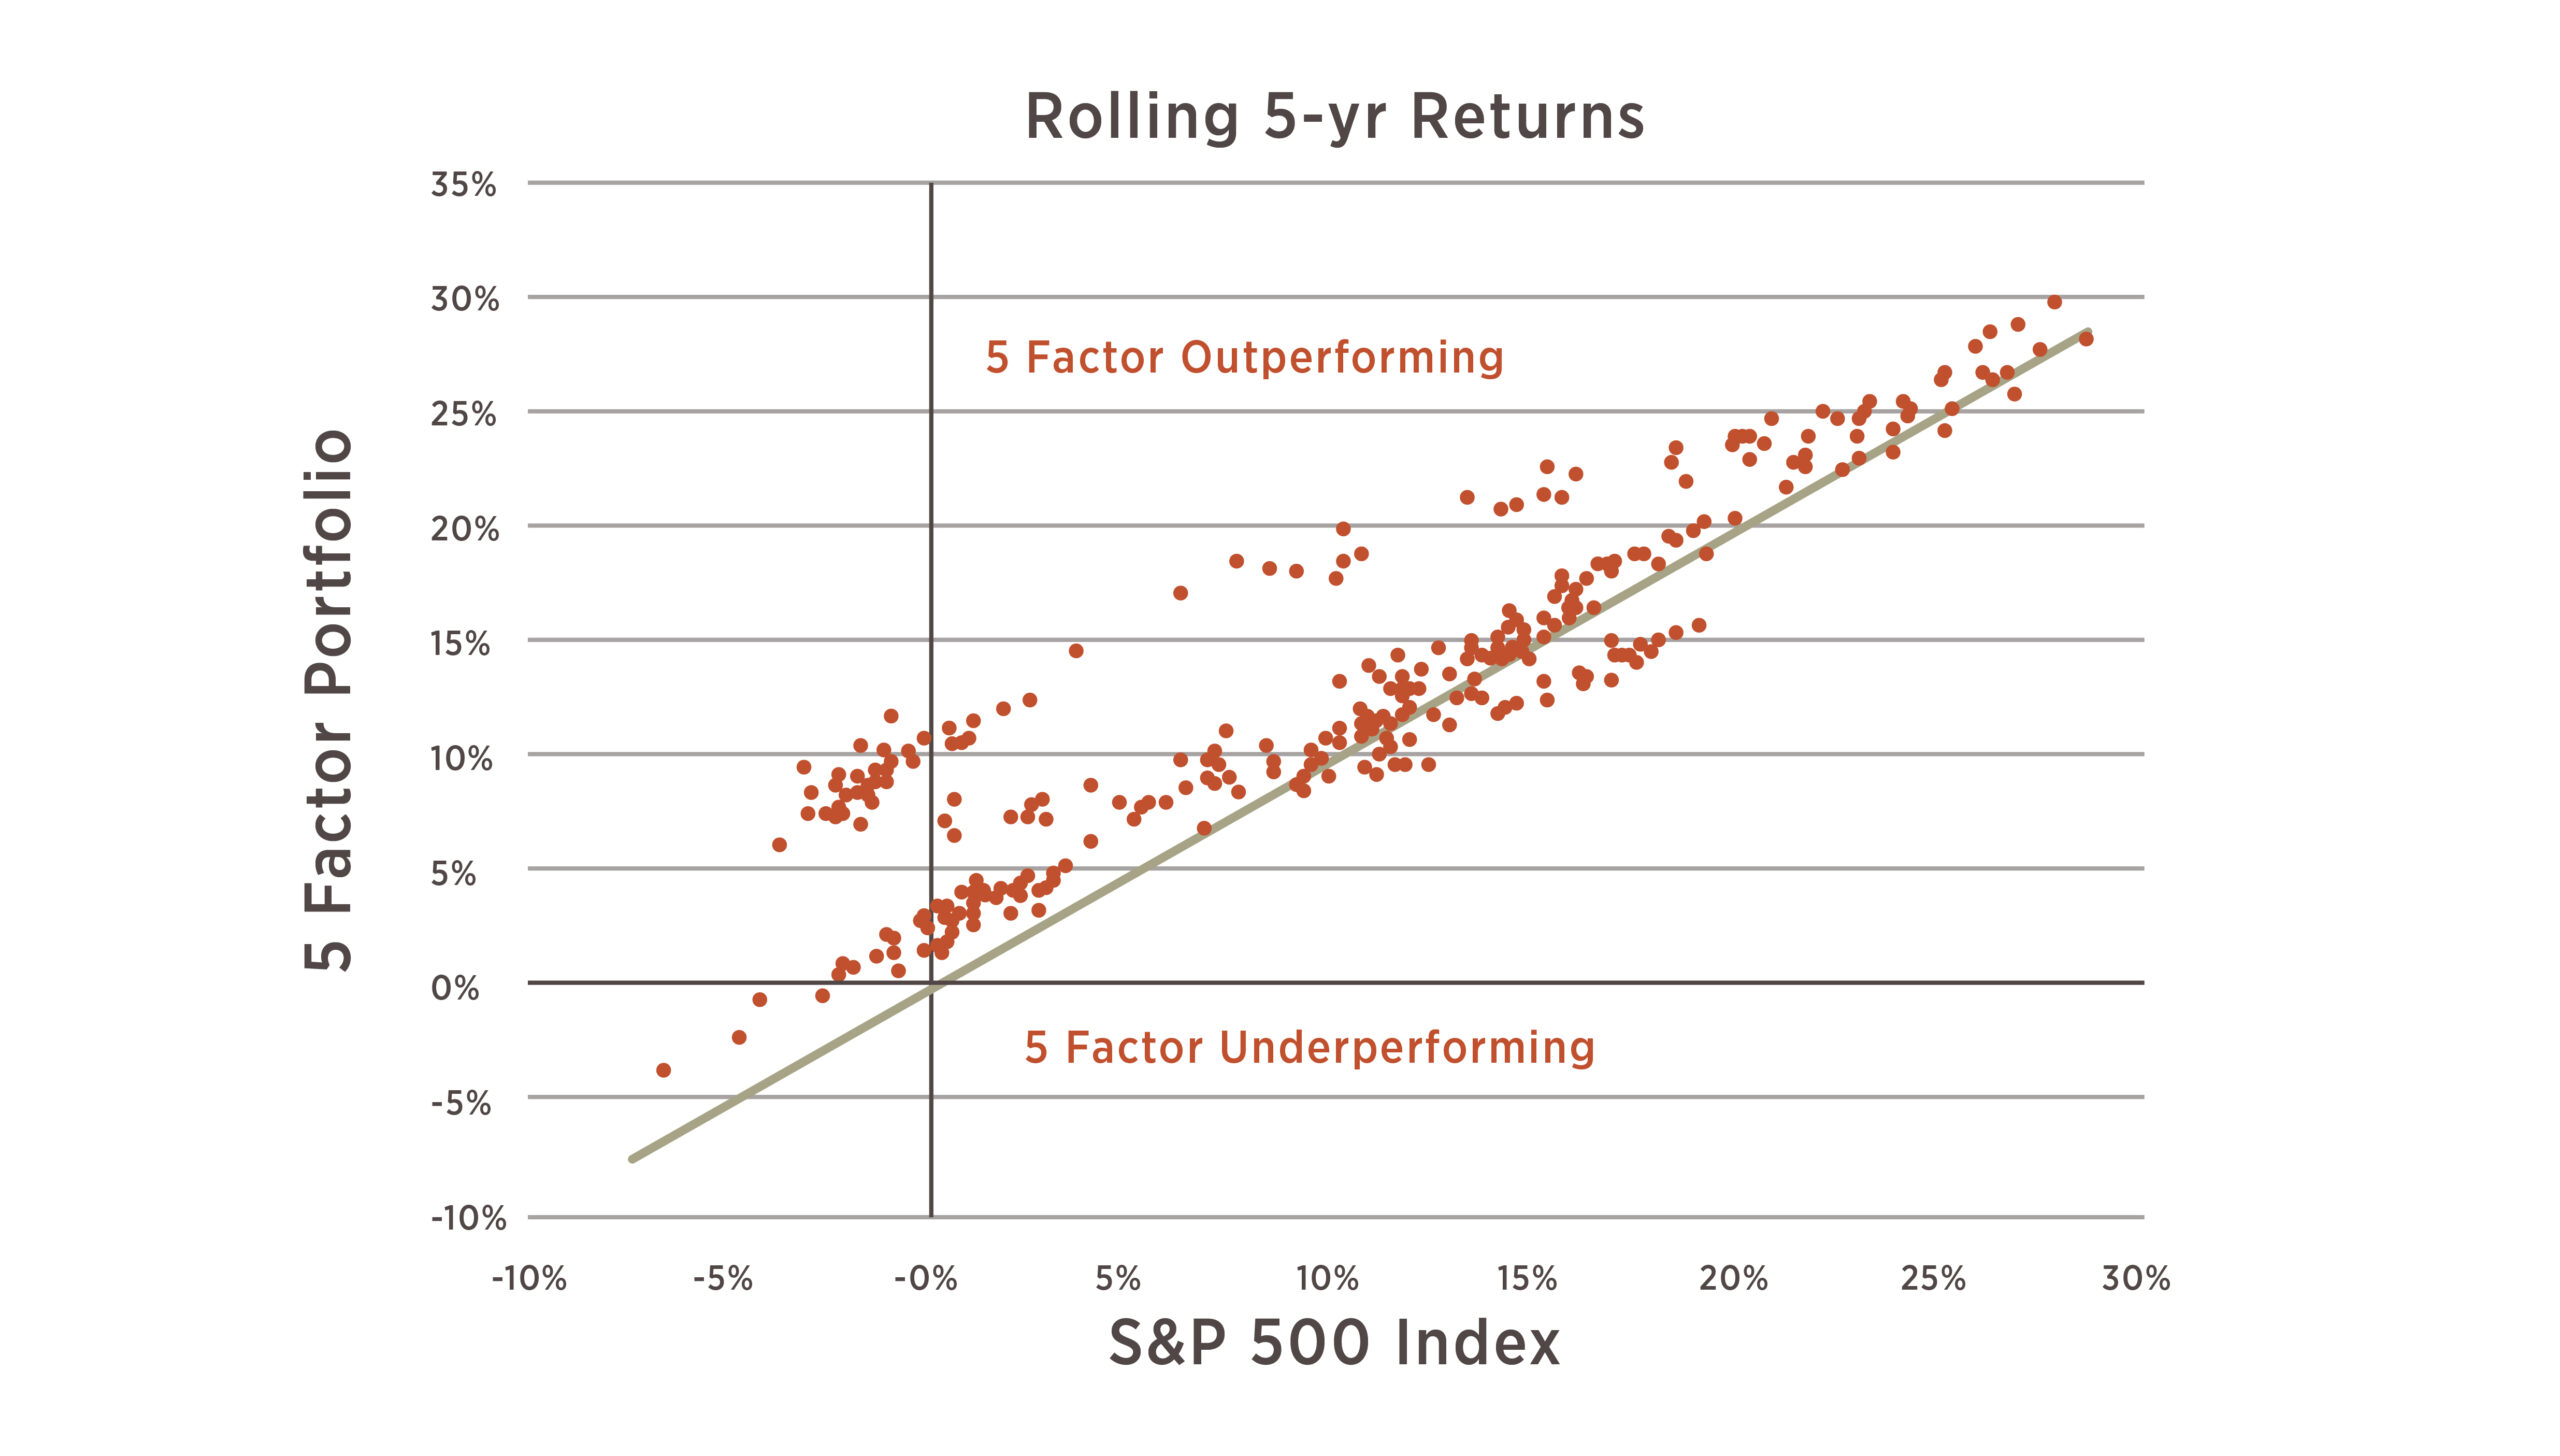
Source: Factset (Jan. 1991 – June 2019) as of June 30, 2019; Bloomberg (July 2019 – June 2023) as of June 30, 2023. Performance reflects backtested data using monthly return data from June 1992 – June 2023;
In summary, hopefully, this series has been educational and insightful. We wanted to articulate that equities remain a pertinent piece of the puzzle to compounding wealth, but the ride may not always be smooth. Tracking error can be a psychological risk, in particular when it is not working in your favor. By understanding tracking error, investors will be better suited to understand the risks that come with an actively managed portfolio, in particular in the very short term. Deviations from a benchmark, namely those that are constantly being shown on TV (like the S&P 500), should be expected. With proper management, we believe that tracking error should be tolerated because it is the toll you pay to achieve alpha.
July 28, 2023
Andrew Mies, CFA
Jason Mayers, CFA
The investment strategy presented may not be suitable for all investors. Please contact your financial advisor and review important disclosures before making any investment decisions.