December 7, 2022
Andrew Mies, CFA®
Jason Mayers, CFA®
Determining when or if the economy is in a recession is not an exact science. The decision is made by the National Bureau of Economic Research (NBER) and the start date of a recession is seen in retrospect, meaning the economy will have already been in a recession before officially being declared as such. While it is a difficult exercise to time a recession precisely, there are indicators that can support a theory that one is on the horizon and what history shows is likely to happen when the next recession does occur. In this market commentary, we will illustrate how certain measures have been strong predictors of a looming recession and what a recession has historically meant for equity and bond markets, specifically through company earnings and the premium that investors should desire for taking on additional risks.
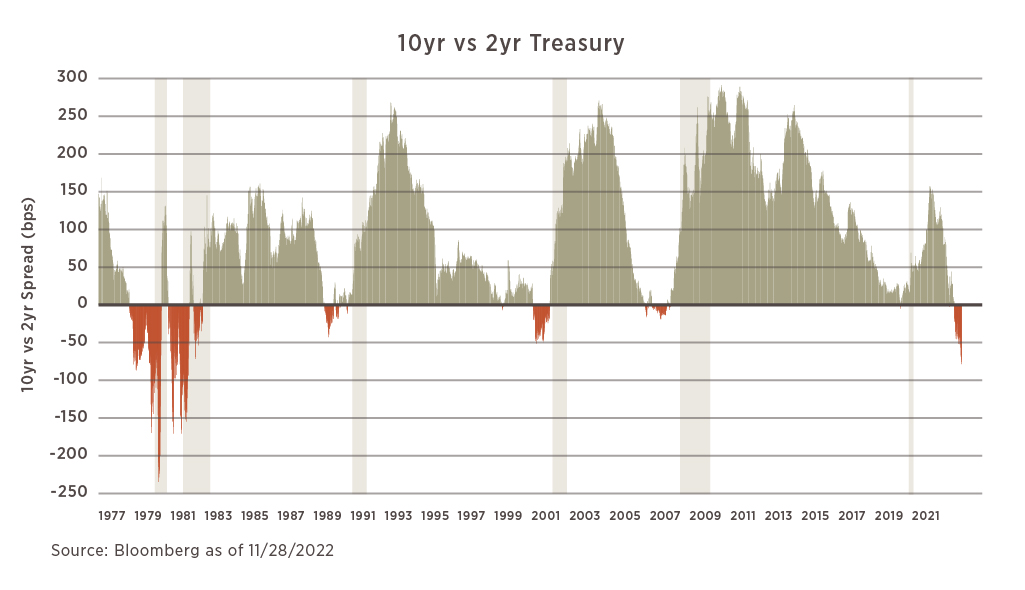
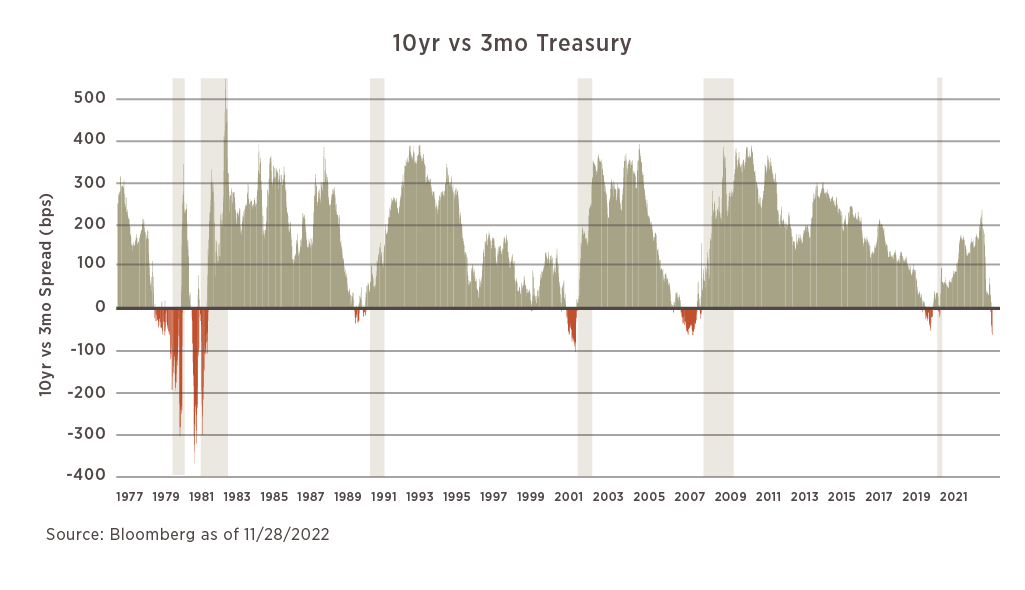
Yield Curve Inversion
You can see from the below graphics that the inversion of the yield curve, which is defined by short rates (2yr. or 3mo.) being higher than long rates (10yr.), has historically been a good barometer for detecting a recession. This measure does vary in the length of time from initial inversion to recession, but for all intents and purposes, a recession has historically occurred within a 2-year window of the first point of inversion. In the last four recessions each downturn was preceded by a re-steepening of the curve that was driven by a pivot in Fed policy, meaning they were cutting rates and causing short rates to fall faster than long rates. Today’s environment is most similar to the inflationary period of the late 70’s/early 80’s in which a recession had been defined prior to the yield curve returning to a more normalized slope.
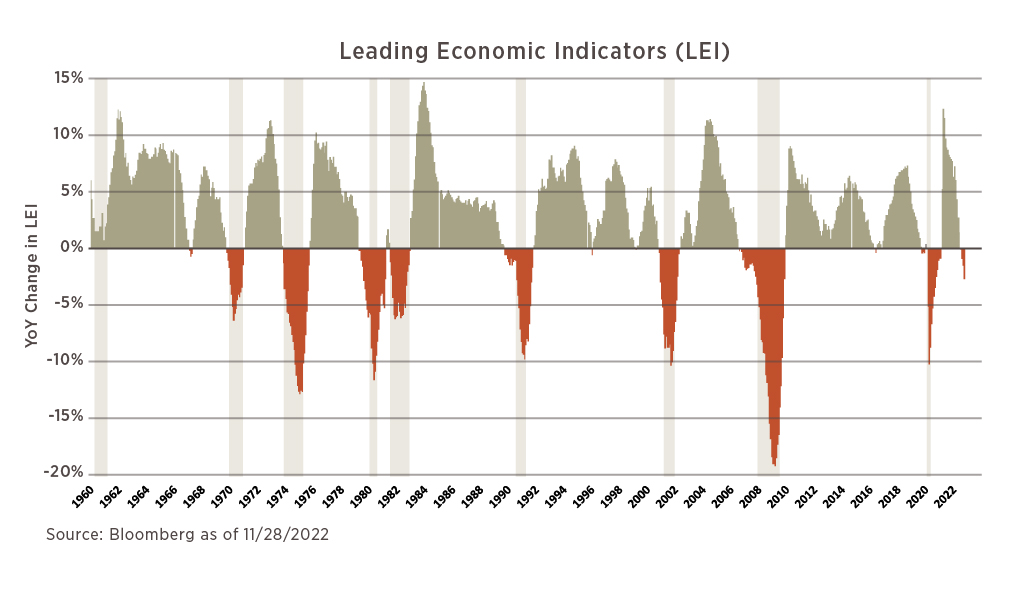
Conference Board Leading Economic Indicators (LEI)
The below is a representation of the year-over-year change in the LEI Index, which is a composite of 10 variables viewed as having predictive capabilities in the turning point of a business cycle. The US experienced its 4th straight negative reading in October, and since 1970, each time there has been at least two consecutive months of declines a recession has always occurred in relatively short order. The longest lag between a negative reading and recession was 16-months in the ’08-’09 Financial Crisis.
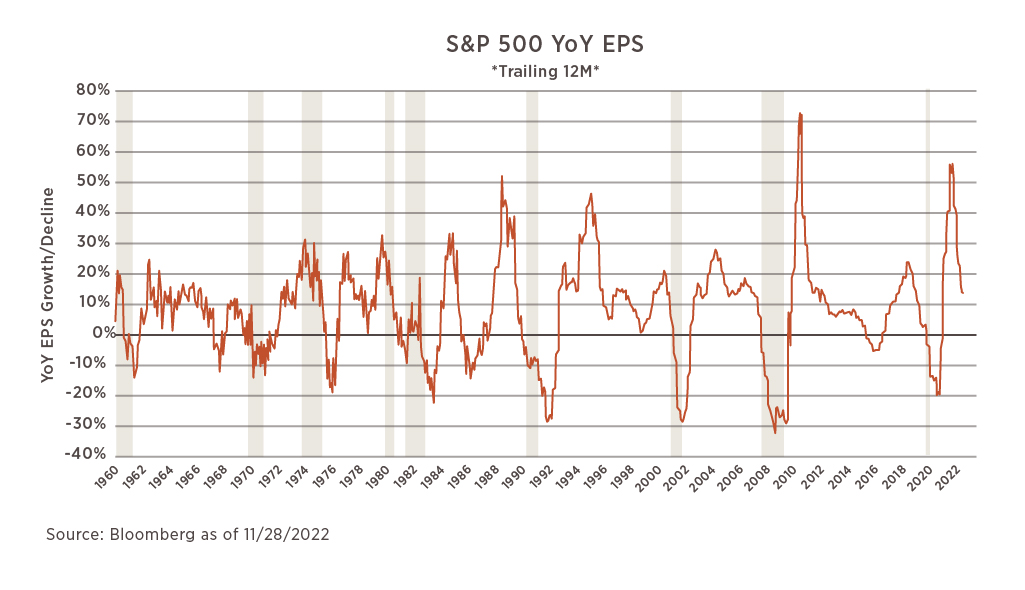
S&P 500 Earnings
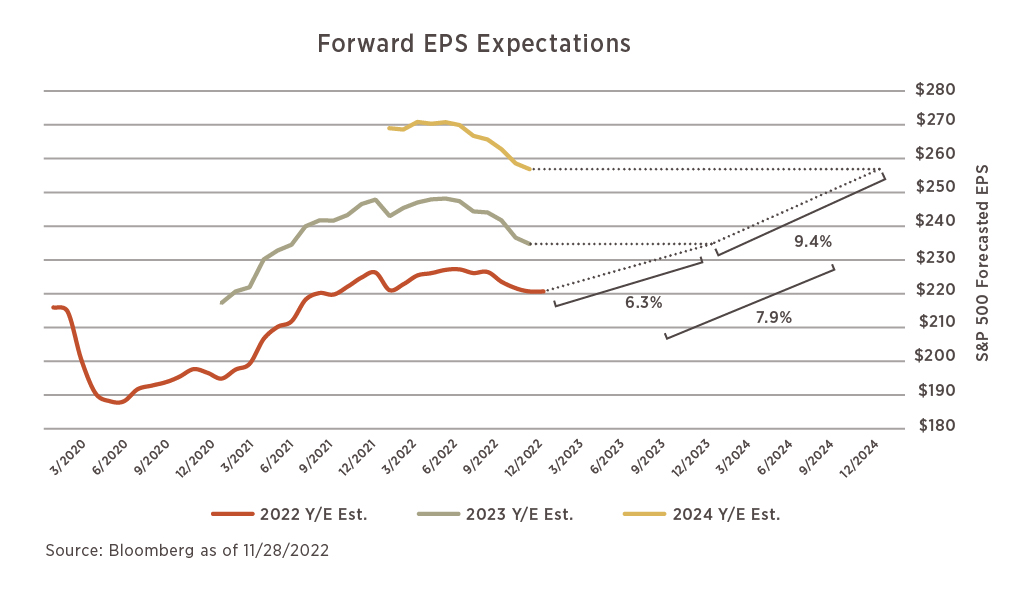
Today’s forward earnings expectations do not align with what has historically transpired in a recession. Again, we are not currently known to be in a recession, but if the expectation is that the US is headed for one, this can provide a good range of expectations. As the charts that follow show, we should expect to see earnings decline in the event an economic downturn takes place. This is best illustrated by the 1st chart showing how earnings decline as they go through the trough of an economic cycle.
The 2nd graphic shows what the market is expecting in the years ahead, which currently points to earnings growth in both 2023 and 2024. While these expectations have declined throughout the year, history would suggest that if a recession is looming, the market should not be pricing in growth at all.
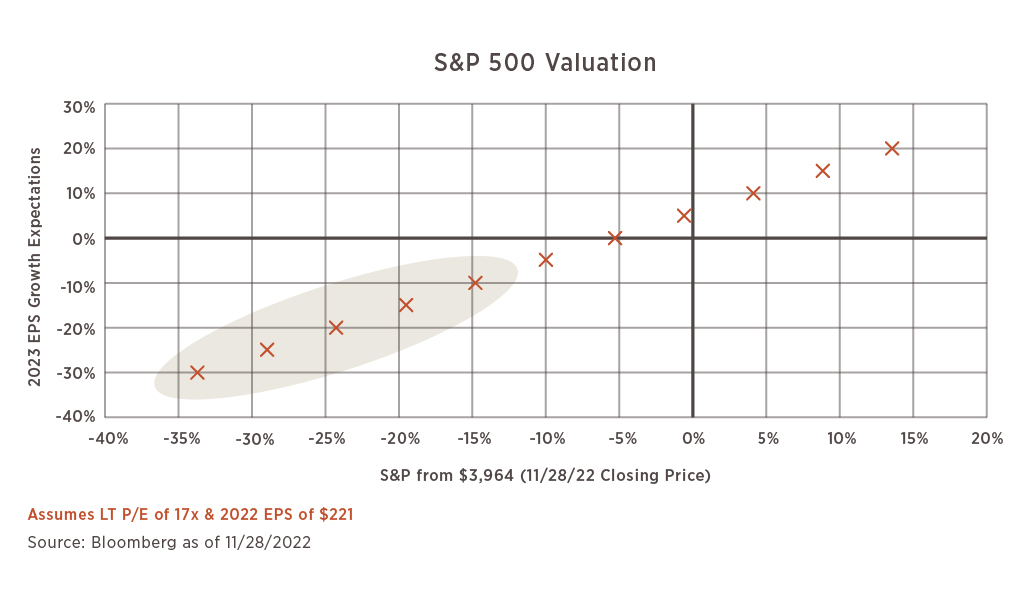
Finally, the 3rd chart details where the S&P could go from here (11/28/2022) if some simple assumptions are made: (1) 2022 EPS Expectations are accurate and (2) the S&P will trade at its long-term average valuation of a 17x P/E Ratio. As the 1st chart showed, in the event of a recession, EPS declines range from -10% to -30%. If a recession were to occur in 2023, the S&P needs to go down from where it is today to trade at its longer-term valuation.
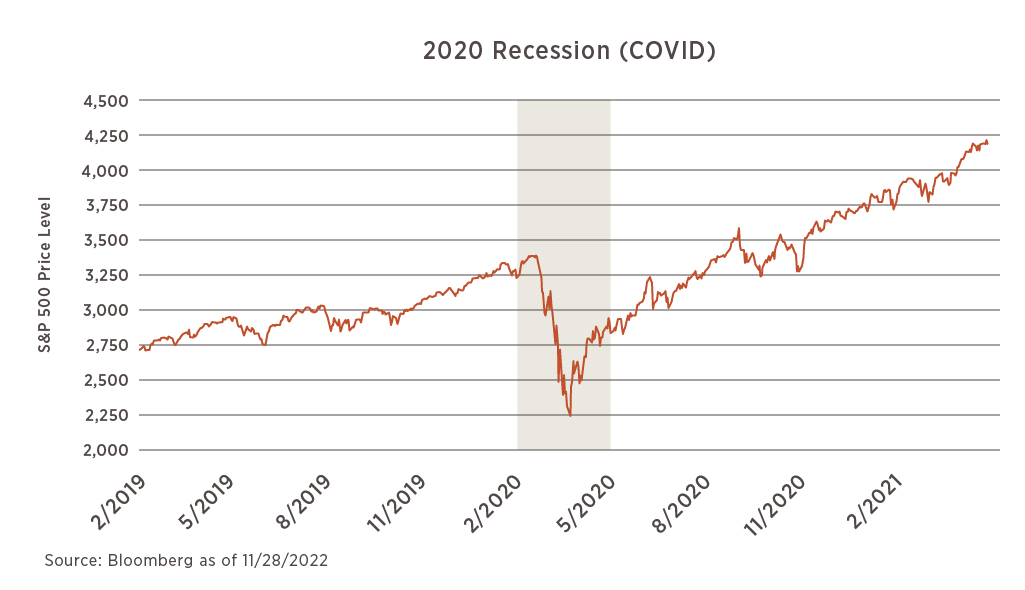
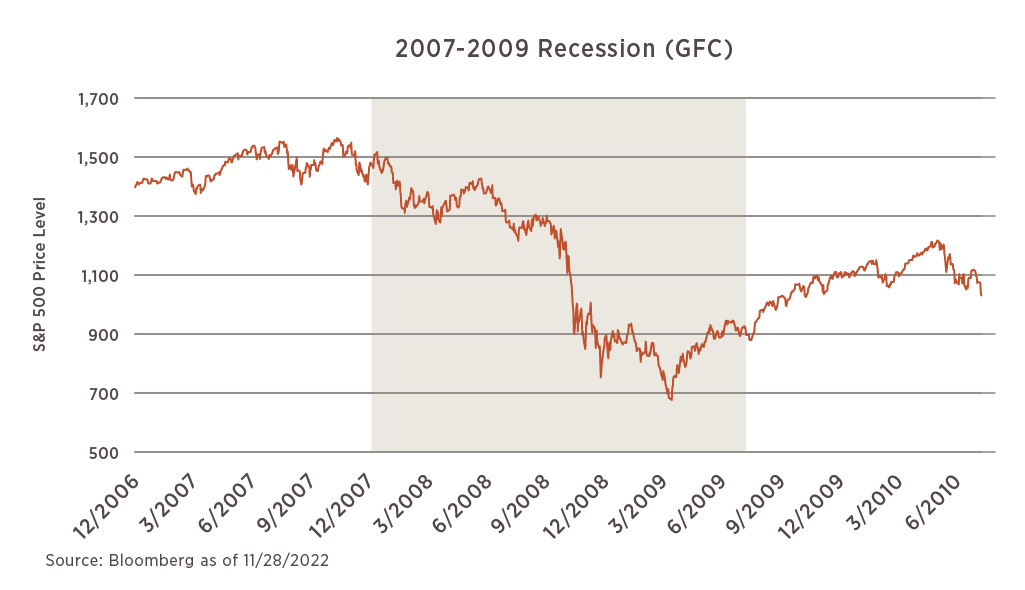
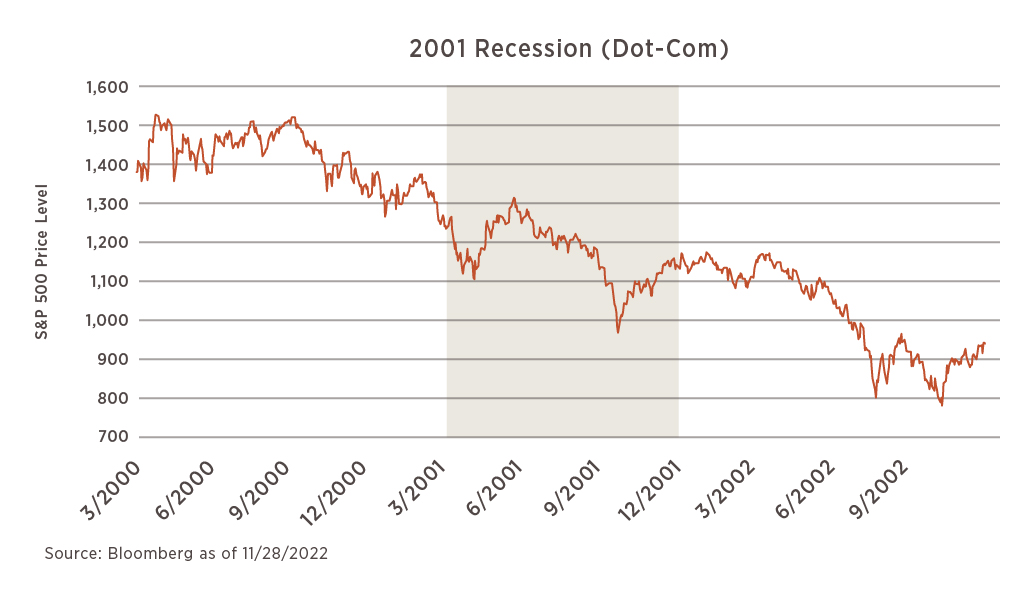
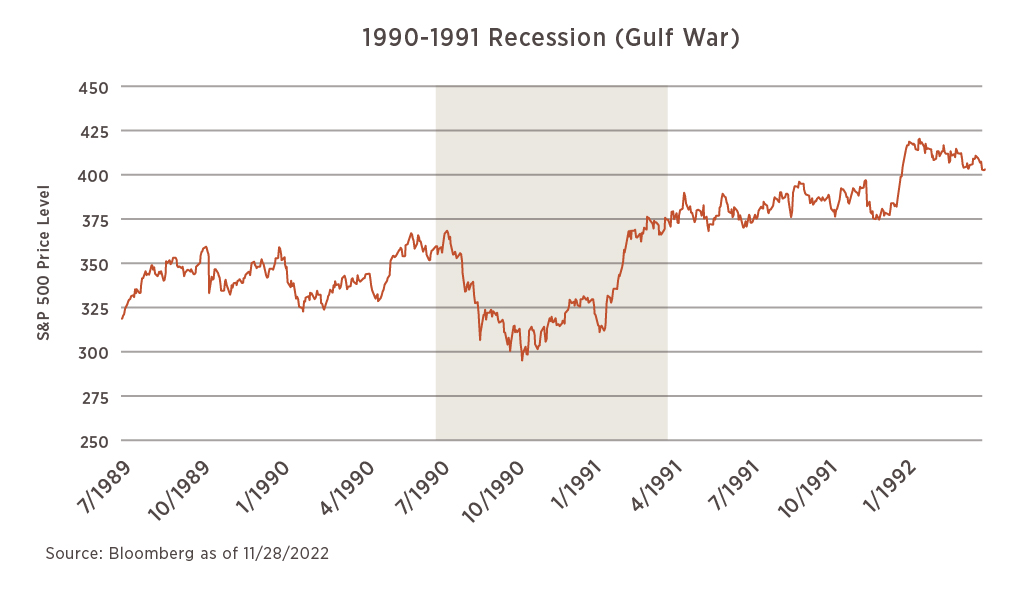
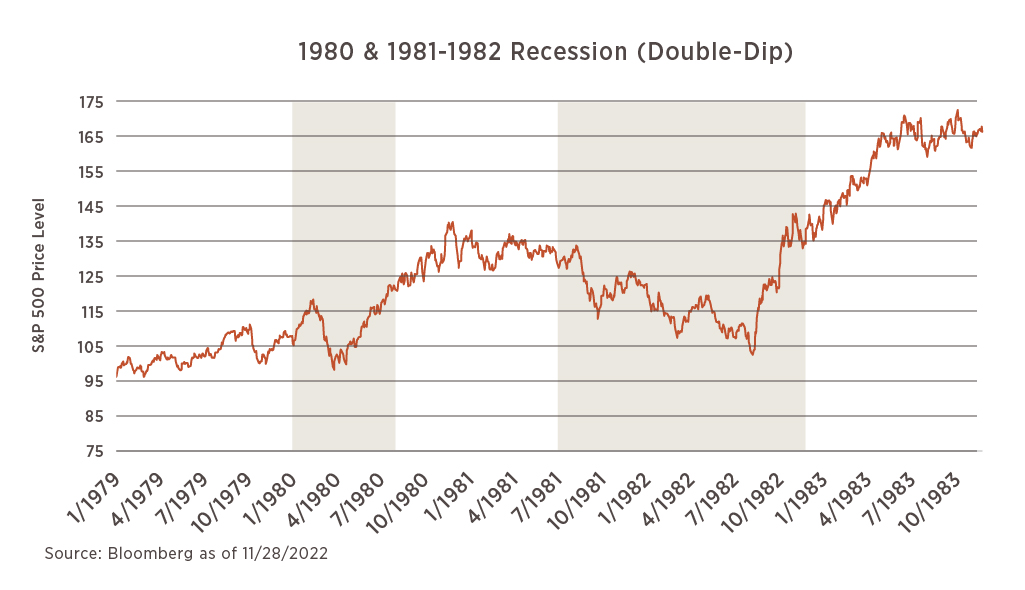
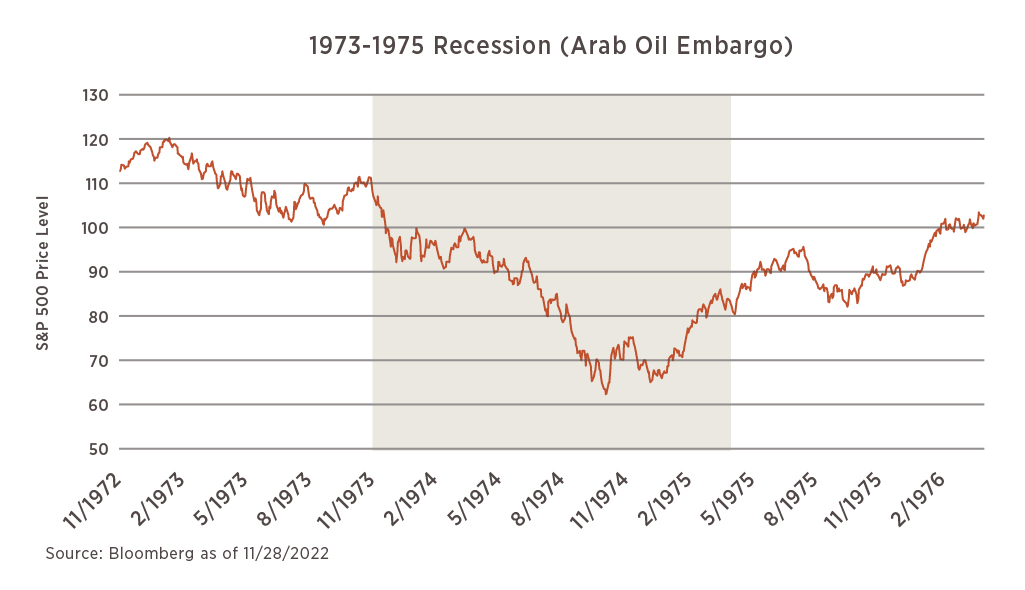
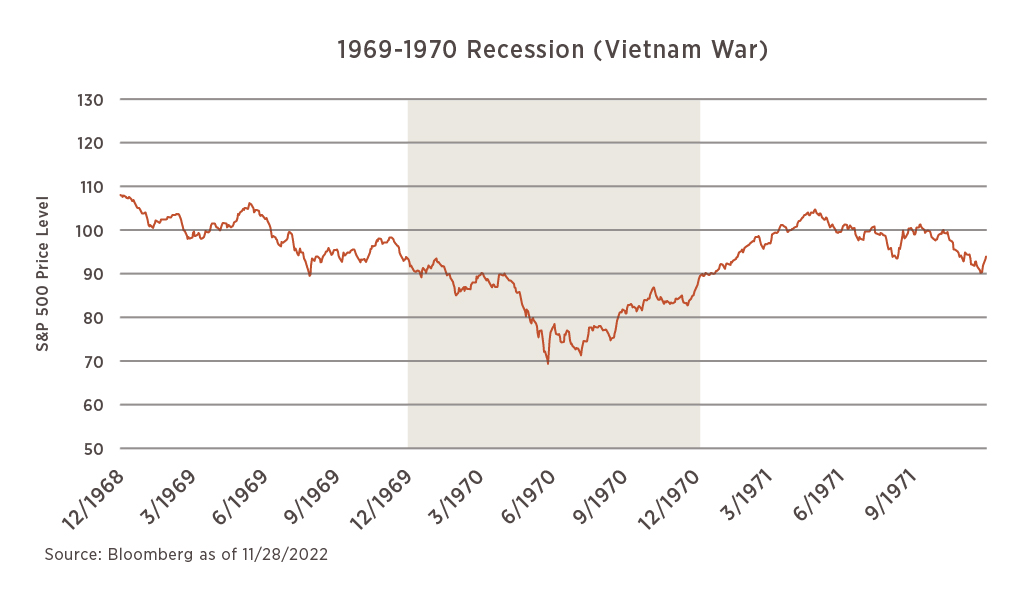
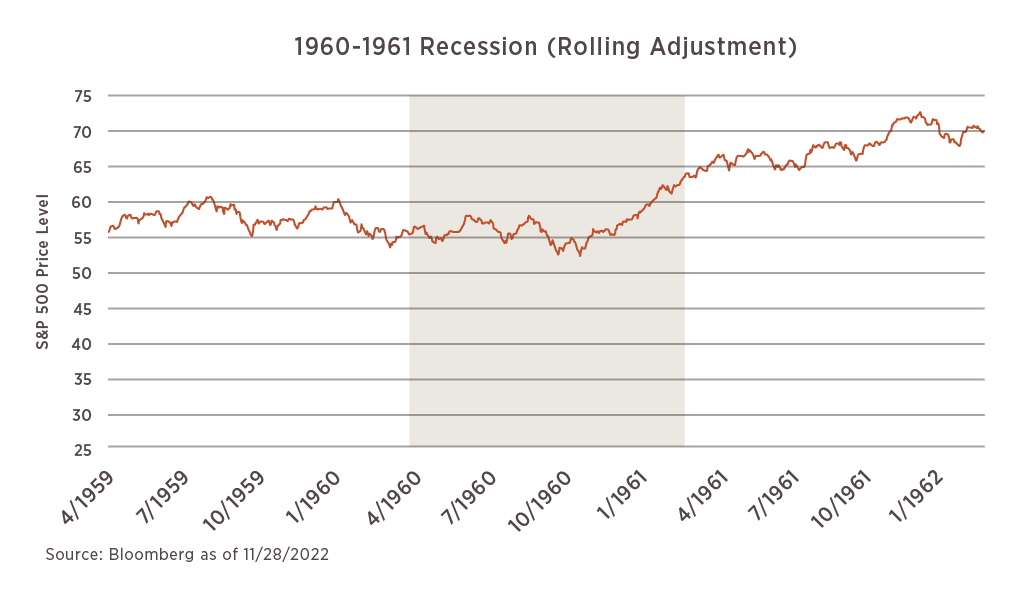
S&P 500 Recessions
We have highlighted throughout the year that the S&P 500 has entered a bear market. While the recent equity rally from mid-October has been nice to see, looking back through the history of the last 9 recessions would show the S&P has always bottomed during the recession, not prior to. If you consider where the market sits today and the prospects of a recession on the horizon, this history suggests there could be a new low point from what already has occurred in 2022.
Bond Markets
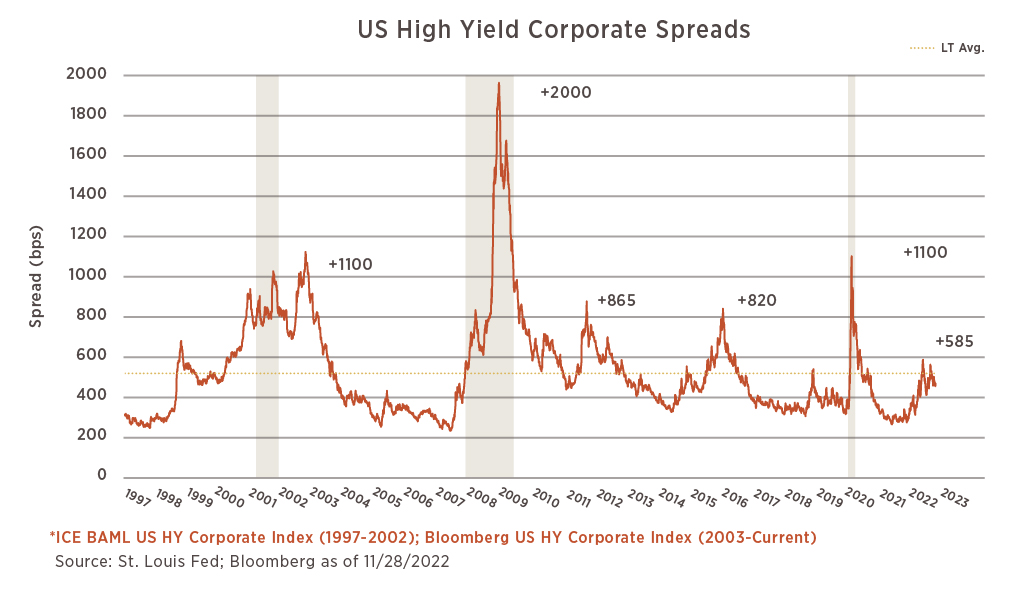
Looking at your fixed income portfolio this year might make you think otherwise, but bond markets have yet to price in recessionary risks. The drawdown in 2022 is largely a result of the rapid rise in interest rates, not from a widening of credit spreads which is a measure of how much premium the market wants for taking on added risk. This chart of the US High Yield Bond Index shows how much more a HY bond pays relative to a risk-free Treasury. Given prior recessions, a higher premium relative to what is priced in the market today should be warranted in the event a recession was to occur. Perhaps more surprising is that the current spread is lower than its long-term average even as the prospects for a recession increase.
In Conclusion
While the US economy is not known to currently be in a recession, the historical data we see would suggests that the market is not pricing in the risk of such an event happening accordingly. As Mark Twain infamously said, “History doesn’t always repeat itself, but it often rhymes.”