It’s time to get real about bond yields. No, really.
This is a brief overview of real yields, a critical component of interest rates that, until recently, has largely flown under the radar.
To provide a brief historical context, the Global Financial Crisis (GFC) in 2008 ushered in a prolonged period of low interest rates across much of the developed world as policymakers sought to stimulate their economies. This regime came to an end following COVID, which introduced a wave of fiscal and monetary stimulus alongside major supply chain disruptions.
The combination of supply-side pressures and major policy stimulus produced an inflationary shock not experienced in decades. Ultimately, this prompted central banks around the world to embark on an aggressive rate-hiking cycle. In turn, interest rates across the developed world have risen to levels not seen in nearly two decades.
While inflationary pressures were the initial driver behind the rise in interest rates, much of the recent move to higher rates in 2026 has come from rising real yields. Understanding the components that make up interest rates and why they rise or fall can provide insight into what the market is signaling to investors. Our objective is to detail the forces driving real yields higher and help explain how they have awakened what, for nearly two decades, has been a relatively sleepy bond market.
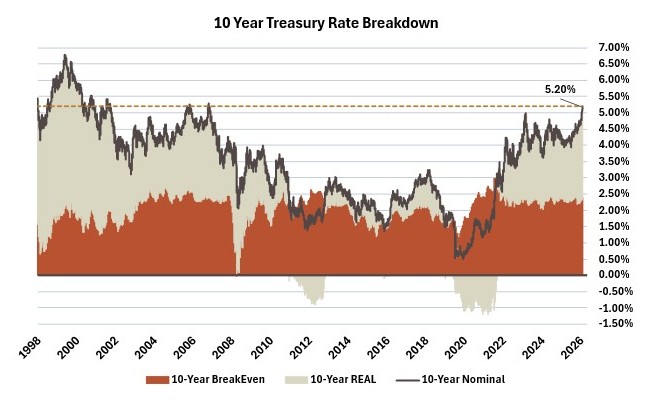
To start, we show an illustration of the components of the U.S. 10-Year Treasury Yield dating back to the late 1990s. It captures how much of the prevailing nominal rate is coming from Real Yields (tan) and Inflation Expectations (red). These components receive less attention because the media and financial institutions tend to focus on the headline nominal yield. Simply put, the existing nominal rate is Inflation Expectations + Real Yields. As was indicated earlier, the prevailing 10-Year U.S. Treasury Yield at 5.20% is at its highest level in nearly two decades.
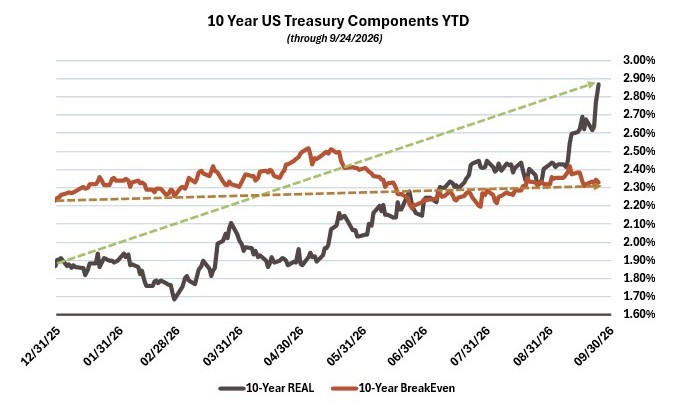
Turning our attention to the current environment, the next chart exhibits how the two components have shifted thus far in 2026. After all, a key narrative in today’s market is to discuss the implications of the 10-Year Treasury moving from 4.17% up to 5.20% – an increase of 103 basis points.
While inflation grabs a lot of the headlines, especially with ongoing global conflicts and the recent rate hike by the Federal Reserve, market-implied inflation compensation over the next decade has largely been unchanged. Instead, the rise in rates in 2026 has been driven by the increase in real yields. Put another way, this increase is the market demanding higher real returns.
At a basic level, this demand for higher real returns can come from:
- The market viewing alternatives to owning U.S. Treasuries as more attractive, requiring Treasuries to offer higher yields to be competitive.
- Investors requiring greater compensation for the risk of owning long-term government debt, including uncertainty around future fiscal deficits and the supply of Treasury securities.
Two commonly noted explanations behind this demand for higher real returns are stronger growth expectations tied to artificial intelligence (AI) and the growing debt and financing needs of the U.S. government.
The equity market has been clear in signaling expectations for future growth, particularly among the companies most closely associated with the rise of AI. Earnings growth for the businesses in close proximity to the AI buildout has exceeded market expectations in recent years. What remains to be seen, however, is whether the technology’s capabilities can ultimately generate productivity gains that exceed the costs required to develop and deploy it.
Government financing has been a prominent market narrative for, well, basically forever. As the U.S. has continued to run large deficits despite a relatively strong economic backdrop, the need to finance those deficits has introduced a lot of Treasury supply for the market to absorb. As the supply grows, investors may demand higher yields to absorb it if demand for Treasuries does not increase at the same pace. In a bit of a snowball effect, greater debt issuance combined with higher rates increases the government’s interest expense, requiring an even larger portion of future borrowing to be devoted to servicing the existing debt.
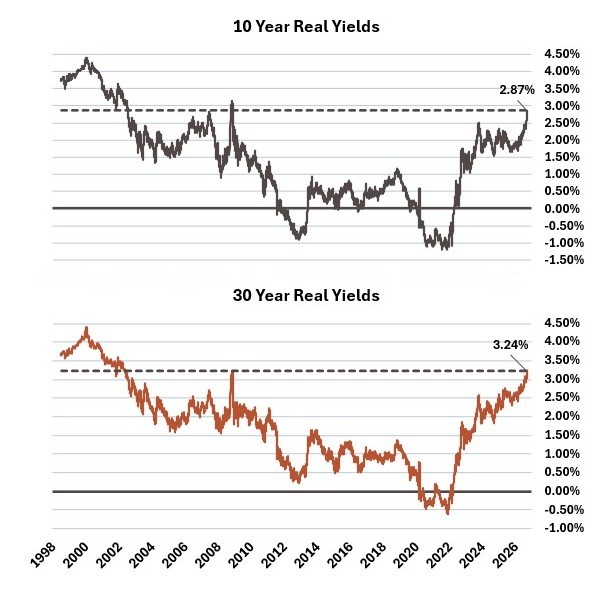
Our final chart breaks out only the real yields for both the 10- and 30-Year maturities. The prevailing level of real yields has not been seen in many years. It may be introducing some interesting implications for the broader investment community, such as whether this level of return will be able to incentivize broader market flows to capture excess returns above inflation.
Will the typically lower volatility of high-quality bonds and the higher real yields begin to offer a competitive risk and return profile relative to equities?
We do not claim to know where that level sits, and it is surely a different trade-off for various market participants. But it is something we are watching closely. As we think about allocation decisions, the prospect of capturing positive returns after inflation introduces an interesting planning dynamic. The cleanest way to do so is by Treasury Inflation-Protected Securities (TIPS). TIPS first came to the market in the late 1990s, which is why our charts start in 1998, and the basic premise of the instrument is an investor may earn a real yield.
- Different from normal Treasury securities, TIPS see their principal value adjusted (either up or down) with the level of inflation (by way of the Consumer Price Index (CPI)).
- Coupon payments (distributions) are set at a fixed rate for the life of the bond;
- However, because the principal value is increasing (or decreasing) by the inflation level, the coupon payments may continue to grow (or shrink) in dollar terms.
- TIPS can still see daily swings in their value, but if held to maturity and the coupon payments are reinvested along the way, an investor can capture that return above inflation (the quoted real yield).
Effectively, the above charts illustrate the market-implied real yields available to TIPS investors at the time of this writing.
To summarize, recent market activity has created an interesting investment environment. Led by expectations for stronger economic growth associated with AI and the government’s continued need to issue debt to finance persistent deficits, real yields have risen to levels rarely observed since TIPS were introduced.
Whether these yields prove sufficient to alter investor behavior remains to be seen, but for the first time in a long time, investors can earn a meaningful return above inflation through high-quality government bonds. We find this to be a development worth watching.