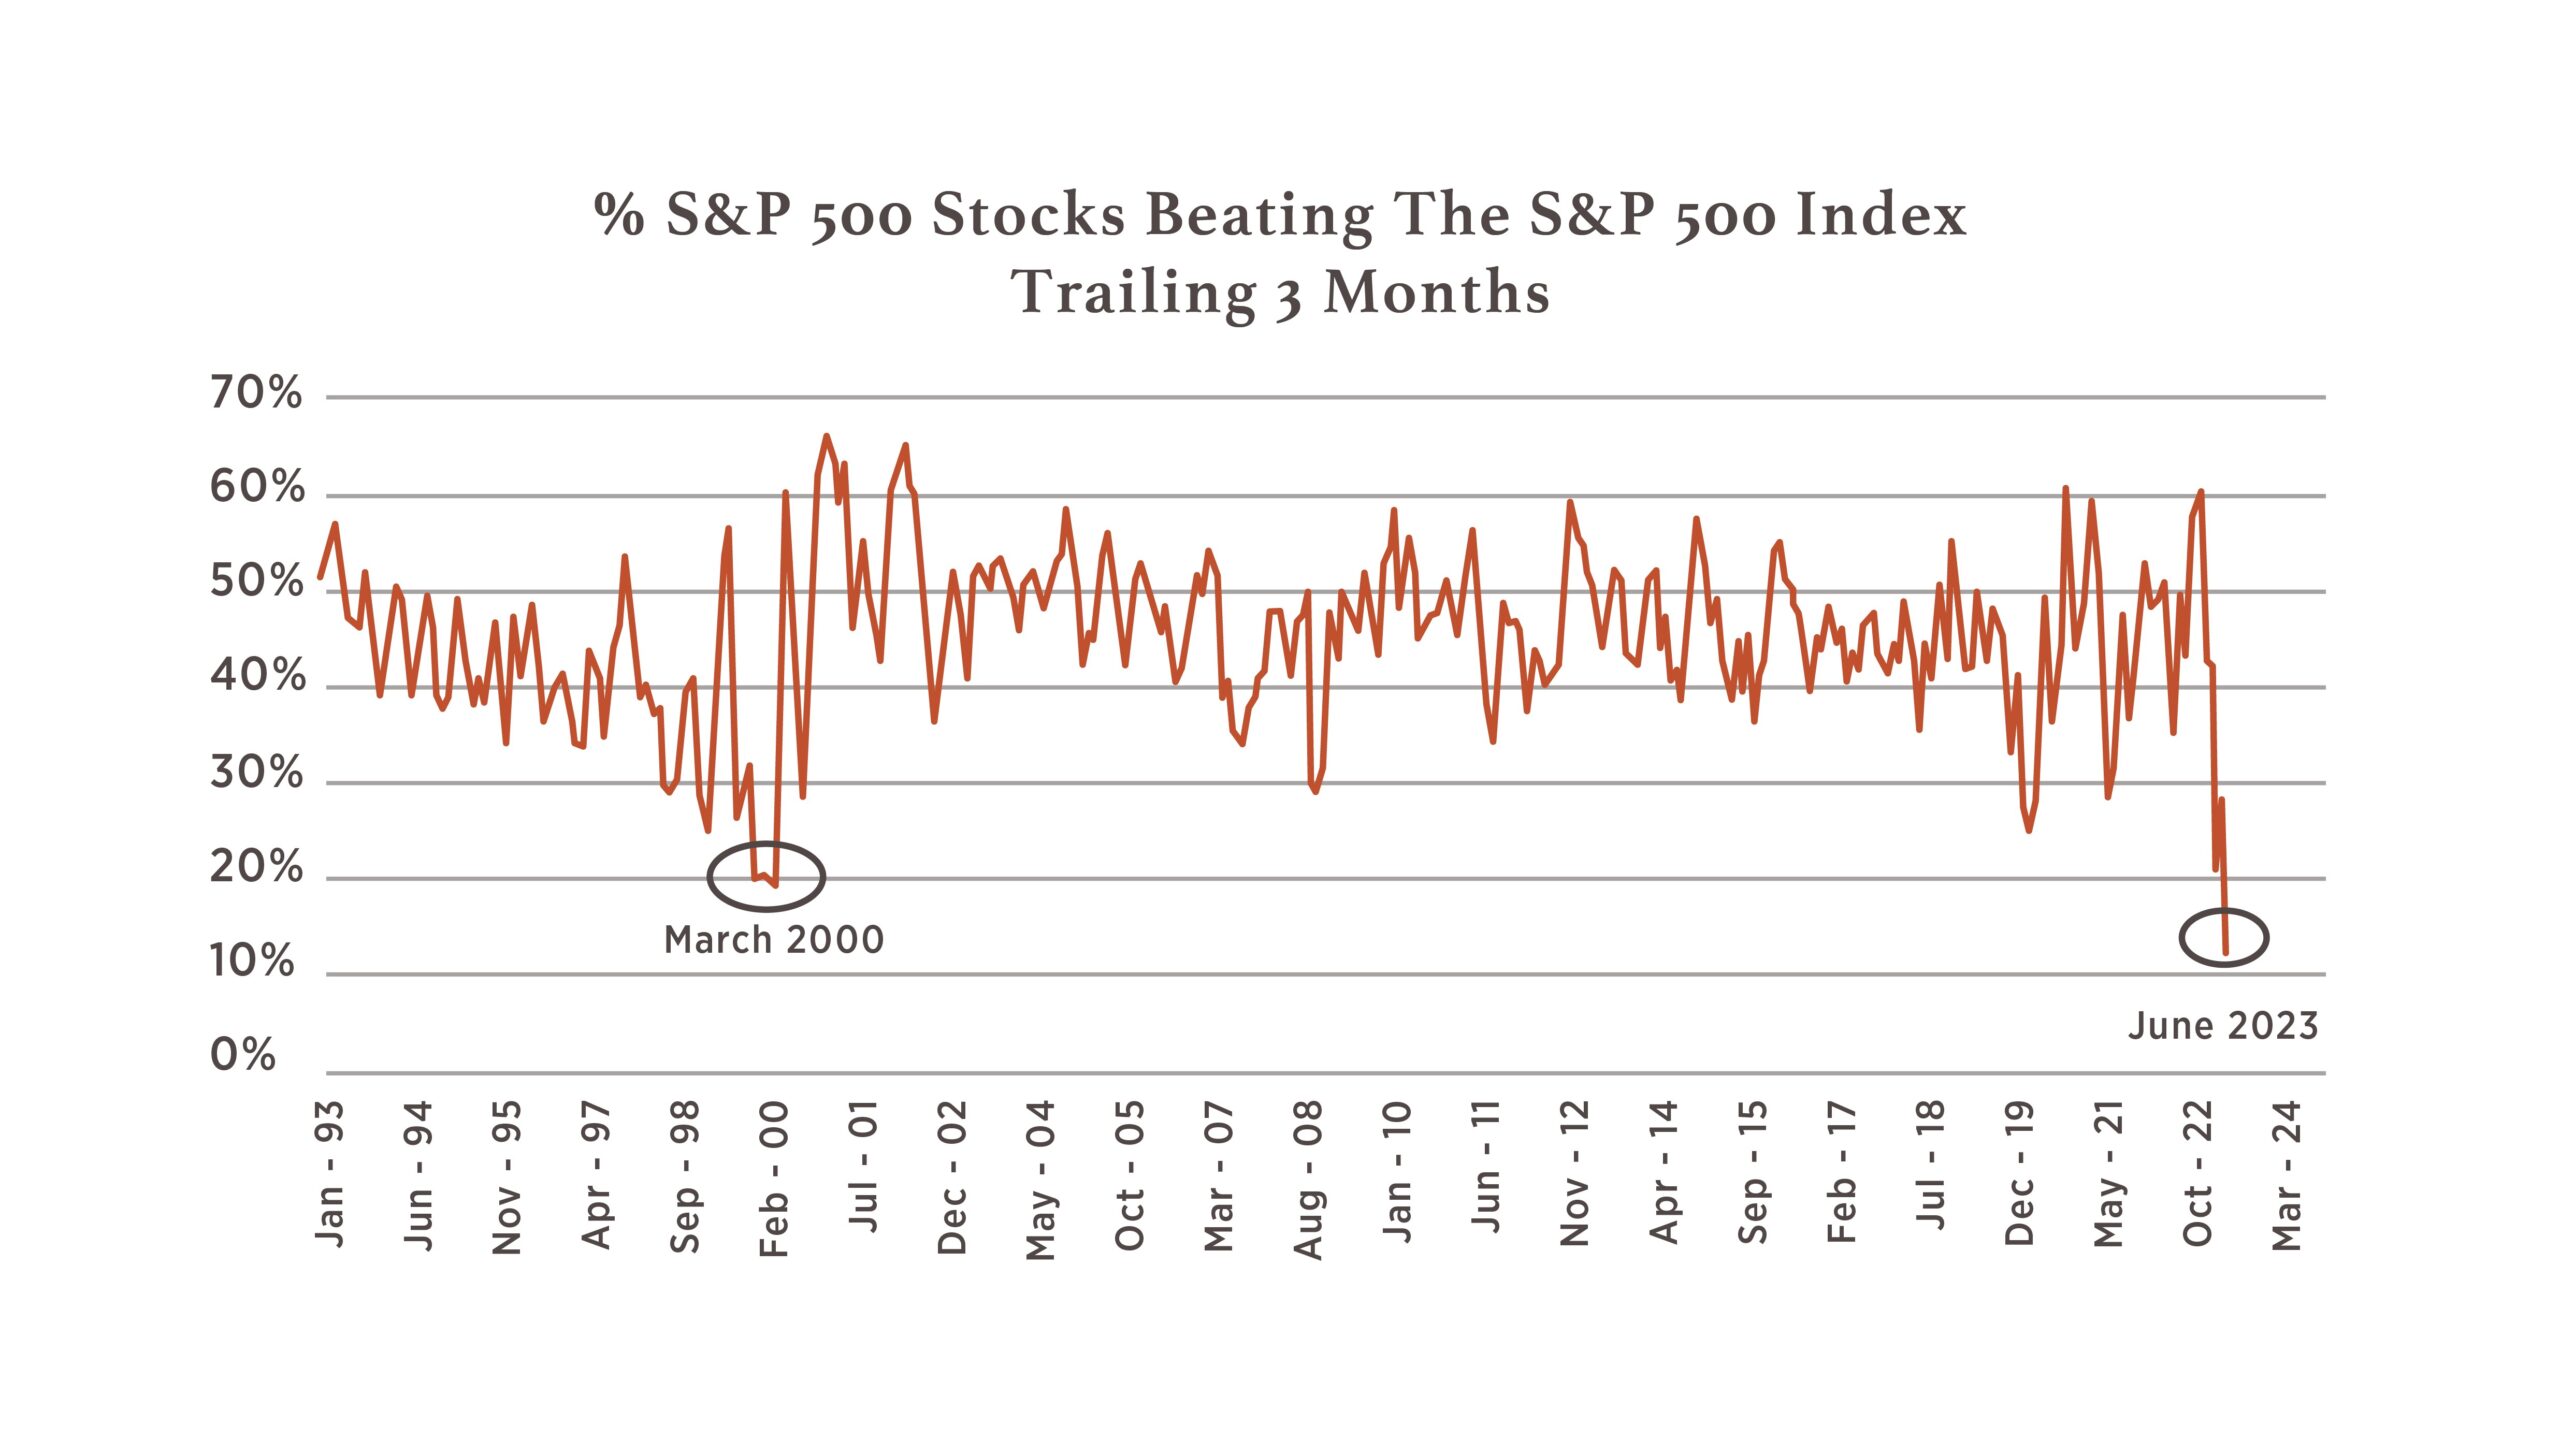
Bad Breadth – not bad breath! Yes, you read that correctly. Breadth is a measure of how many stocks are advancing vs. declining, and as we have illustrated a few times already this year – both in our March Viewpoint and April Blogpost – the concentration of performance amongst some of the largest companies in the US has driven market performance higher as measured by the S&P 500. To show how poor breadth has become in this rally, the below chart shows that just over 10% of stocks in the S&P 500 are beating the overall market index over the past 3 months – this is even lower than the Tech Bubble in 2000. To think about that another way, there are 500 stocks in the S&P 500 and only about 50 have produced a return over the last 3 months that beat the index! We like to refer to this as narrow breadth.
To reiterate what we have encountered so far this year, this graphic re-illustrates what we had shown in our April Blogpost and extends it out to show how that Top 7 cohort has performed through mid-June. Now, at the end of Q1, this collective of 7 accounted for 25.4% of the S&P 500 Index, but as they have continued to shoulder the load, their weight has grown to 28.6% (as of 6/16/23).
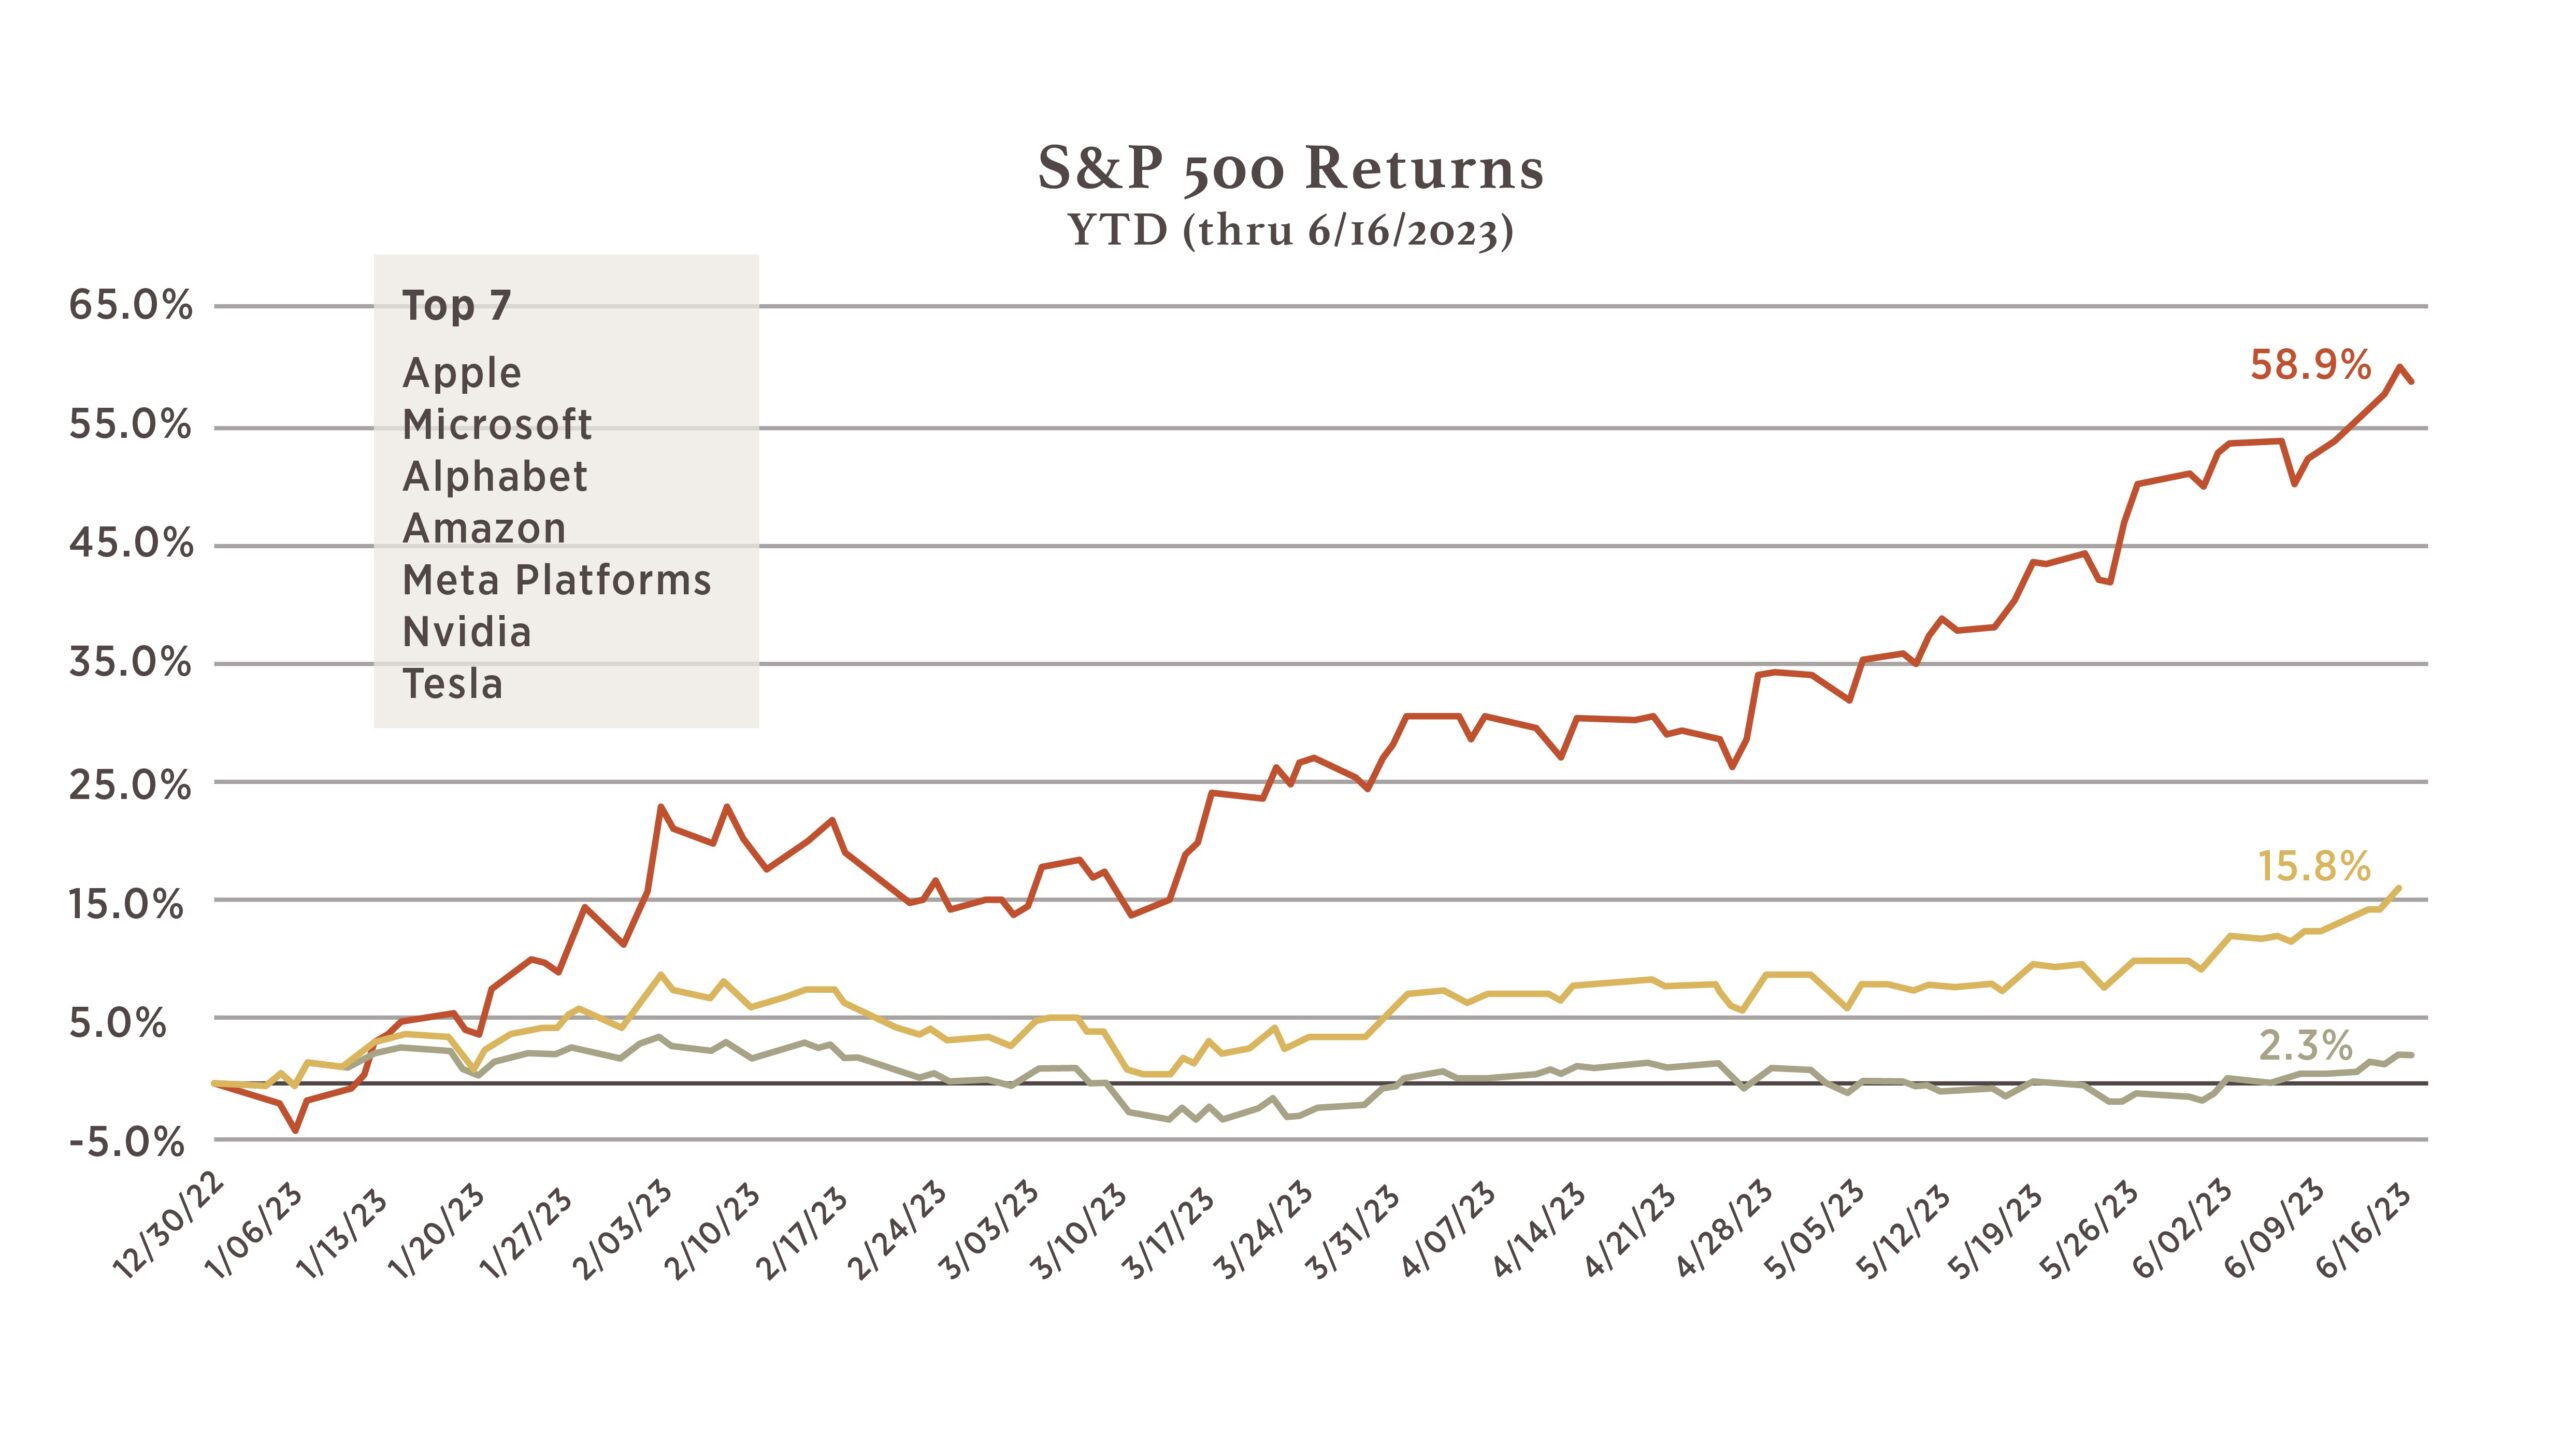
What these charts articulate is that we are in one of the narrowest performing markets we have seen in history which is reliant on a small number of companies that both collectively and individually shoulder much of the weight in the broader market. This current environment suggests that the ‘other 493’ stocks need to start outperforming (widening breadth) or the Top 7 need to underperform.