“Inflation this high hasn’t been seen since the late 1970s” – this headline could have been copy and pasted for each of the past 8 months. Inflation has become THE story for investors and despite the belief that it peaked in March 2022 at 8.5%, the report for May surprised and came in at a new high of 8.6% year-over-year. In this piece we will discuss what is driving inflation to new highs and what are the components that may cause it to continue at high levels for some time.
First, let us get some of the terminology out of the way as it relates to the Consumer Price Index (CPI) and provide a breakdown of the components:
- Headline CPI – this includes the entire basket of goods being measured and is often the number most talked about in the media (hence the term “Headline”).
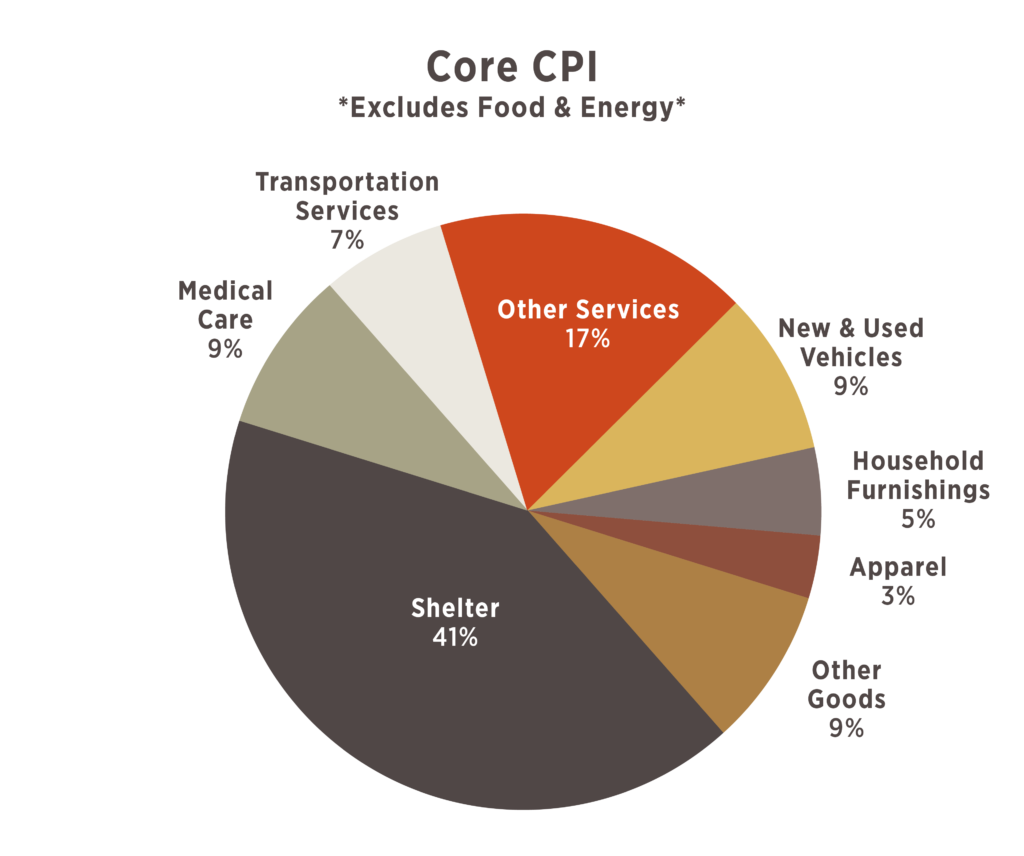
- Core CPI – this measure excludes both Energy and Food because of their volatility and is a better proxy for what the Fed is viewing.
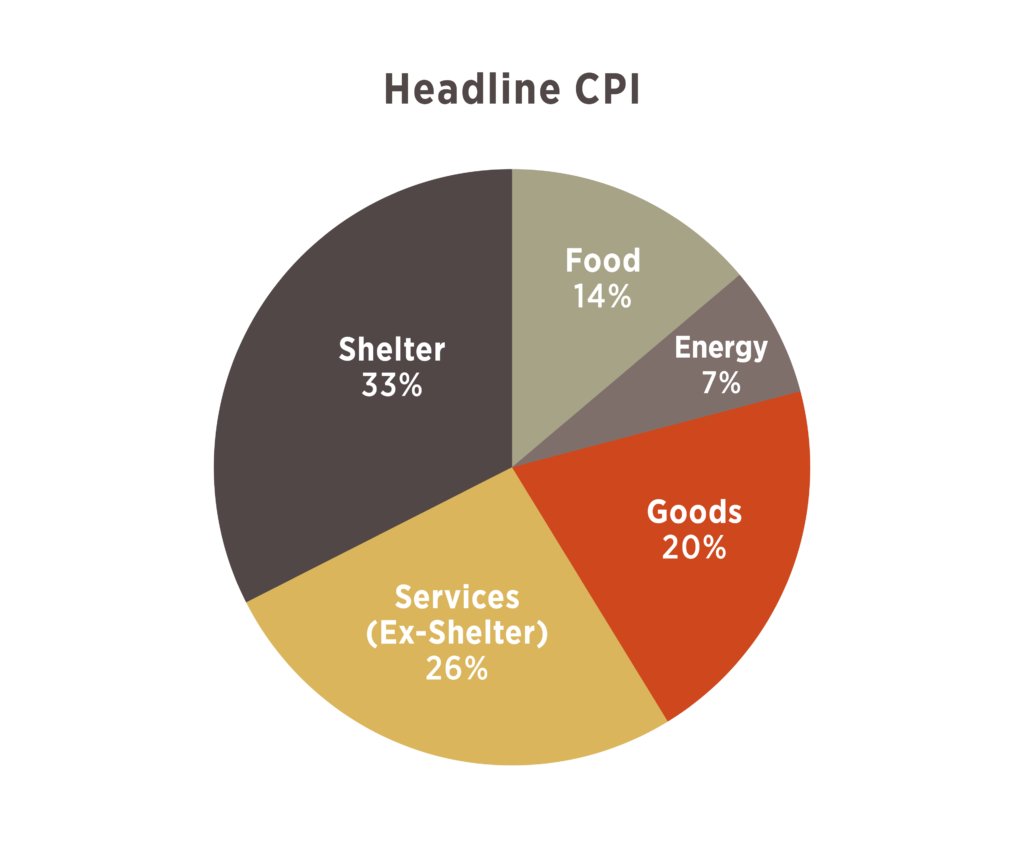
Headline CPI
This measure gets a lot of attention – it is the one being talked about when you hear “inflation is at its highest point in 4 decades”; however, it is 1/5th tied to the volatile sectors of Food and Energy. The war in Ukraine has caused disruptions across commodity markets globally and driven the prices of energy and agricultural products higher. Russia and Ukraine combined account for 12% of global oil production and 30% of global wheat production. These commodity disruptions are being felt globally and are most easily recognized at the gas pump where prices nationally are averaging $5/gallon vs. $3/gallon a year ago. The prices of food bought for the home grew nearly 12% in May vs. the prior year too.
Core CPI
This is not the Fed’s preferred inflation gauge; however, it is a reasonable proxy and is useful in looking at some of the underlying drivers of inflation, in particular splitting out Goods vs. Services. The U.S. is a service-based economy and Core CPI reflects a similar split being ~75% services and ~25% goods.
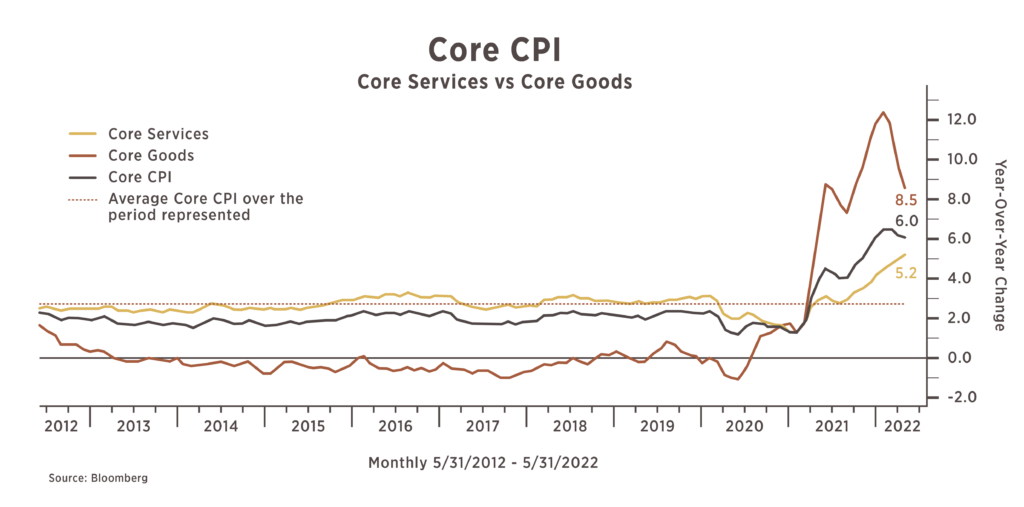
Despite the smaller weight tied to goods, the early stages of inflationary pressure were caused by escalating prices of stuff (used car prices are up 16% year over year). This is a reversal for what had been seen during the previous decade when most goods experienced deflation. The cause of this surge in the prices of goods can be tied to disruptions in the global supply chain due to the COVID shut-downs. The production of goods slowed (or stopped) while consumers and small businesses (primarily in the United States) were receiving unprecedented amounts of government transfer payments . We have all seen, and probably experienced the effects – whether when purchasing a vehicle or furnishing your home – delays became commonplace. While still at high historical levels, we have started to see goods inflation slow down as supply chains have become less burdened and consumers have switched purchasing focuses away from goods and towards services (travel, outside the home dining, etc.).
While goods inflation is moderating, services inflation, which accounts for 75% of the basket, is accelerating. The largest component of the services bucket is shelter (housing). Shelter plays a large role in determining inflation given its significance to household budgets. Following COVID, the demand for housing soared amidst work-from-home policies, stimulus money, and all-time low mortgage rates. Additionally, there was a structural shortage of houses. From 2010-2020, there were fewer new single-family homes completed than in any decade since the 1950s and this coincided with the maturation of the Millennial generation, which is the largest generation ever. This created a perfect storm of too much money competing for too little inventory and as a result we have seen significant home price appreciation and as a result significant increases in rents. The 10 years preceding COVID (Feb. 2012 – Feb. 2022) saw single family homes appreciate by 6%/year according to the Case-Shiller Index. Since then, home appreciation has been nearly 17% annualized with the most recent data point from March 2022 showing an increase of 20.5%. The way “shelter” is calculated into the basket (broadly considered a 1-year lag) means this should provide a tailwind to the “elevated inflation for longer” narrative considering its size of the overall pie.
What does this all mean?
The Fed has a “dual mandate” to maximize employment while keeping prices stable. Given that the unemployment rate is down to 3.6%, the Fed is singularly focused on addressing the high inflation rate. Over the long-term, the Fed has said they are comfortable with inflation running around 2%. Bringing inflation down from over 8% to around 2% will require significant Fed hikes and a slowing in the economy. Many researchers have noted that the Fed has never successfully brought inflation down when it is above 5% without causing a recession.
Hiking rates is the most prevalent tool discussed and has been the focus of the markets – this makes financial conditions more difficult on businesses and the consumer. The most notable impact from the consumer side relates to housing, as mortgage rates have shifted up dramatically, recently surpassing 6.0% on a 30-year loan. Considering this is the largest piece of the inflation pie, the decreasing affordability of homes should slow the pace of home appreciation. For businesses, this makes the cost to borrow higher.
Headline inflation can remain volatile and may be driven by food and energy that are outside of the Fed’s purview. There are larger factors at play for those categories considering the dynamics of the geopolitical environment. Also lurking in the background is continued shutdowns tied to COVID in China, which, when paired with some additional supply chain disruptions tied to labor disputes around the globe, could again create a tricky supply chain dynamic as we enter peak shipping season. This is likely to be a lesser issue going forward as consumer demand has shifted from goods towards services.
The Fed is going to continue increasing rates, that much we know, but the pace may change, as could the absolute number of hikes. The Fed’s decision making is data dependent, and the markets will continue to be driven by expectations and surprises to the various data points. This will continue the volatility seen in markets, and for each rate hike that gets added to expectations, will further pressure valuations.