In our most recent post we showed performance data for the Russell 1000 Growth and Value indexes over the past 40 years – they basically tied at an annualized return of 11% per year. With that knowledge you may ask yourself, “Given the fact that stocks have returned 11% per year for the past 40 years, why are you forecasting equity returns of only 6% for the next 10?”.
In this post, we lay out, in detail, the assumptions that lead us to a 6% expected return. We also lay out what would be necessary to repeat the 11% return investors received in the past.
The total return for a stock investor is comprised of three components: (1) dividend yield; (2) earnings growth; and (3) terminal Price-to-Earnings (P/E) multiple. That’s it. Of these three, only one is particularly volatile and difficult to project – the terminal P/E multiple. The first two components are relatively straightforward to estimate based on history and the information currently available to us.
Component #1: Dividend Yield
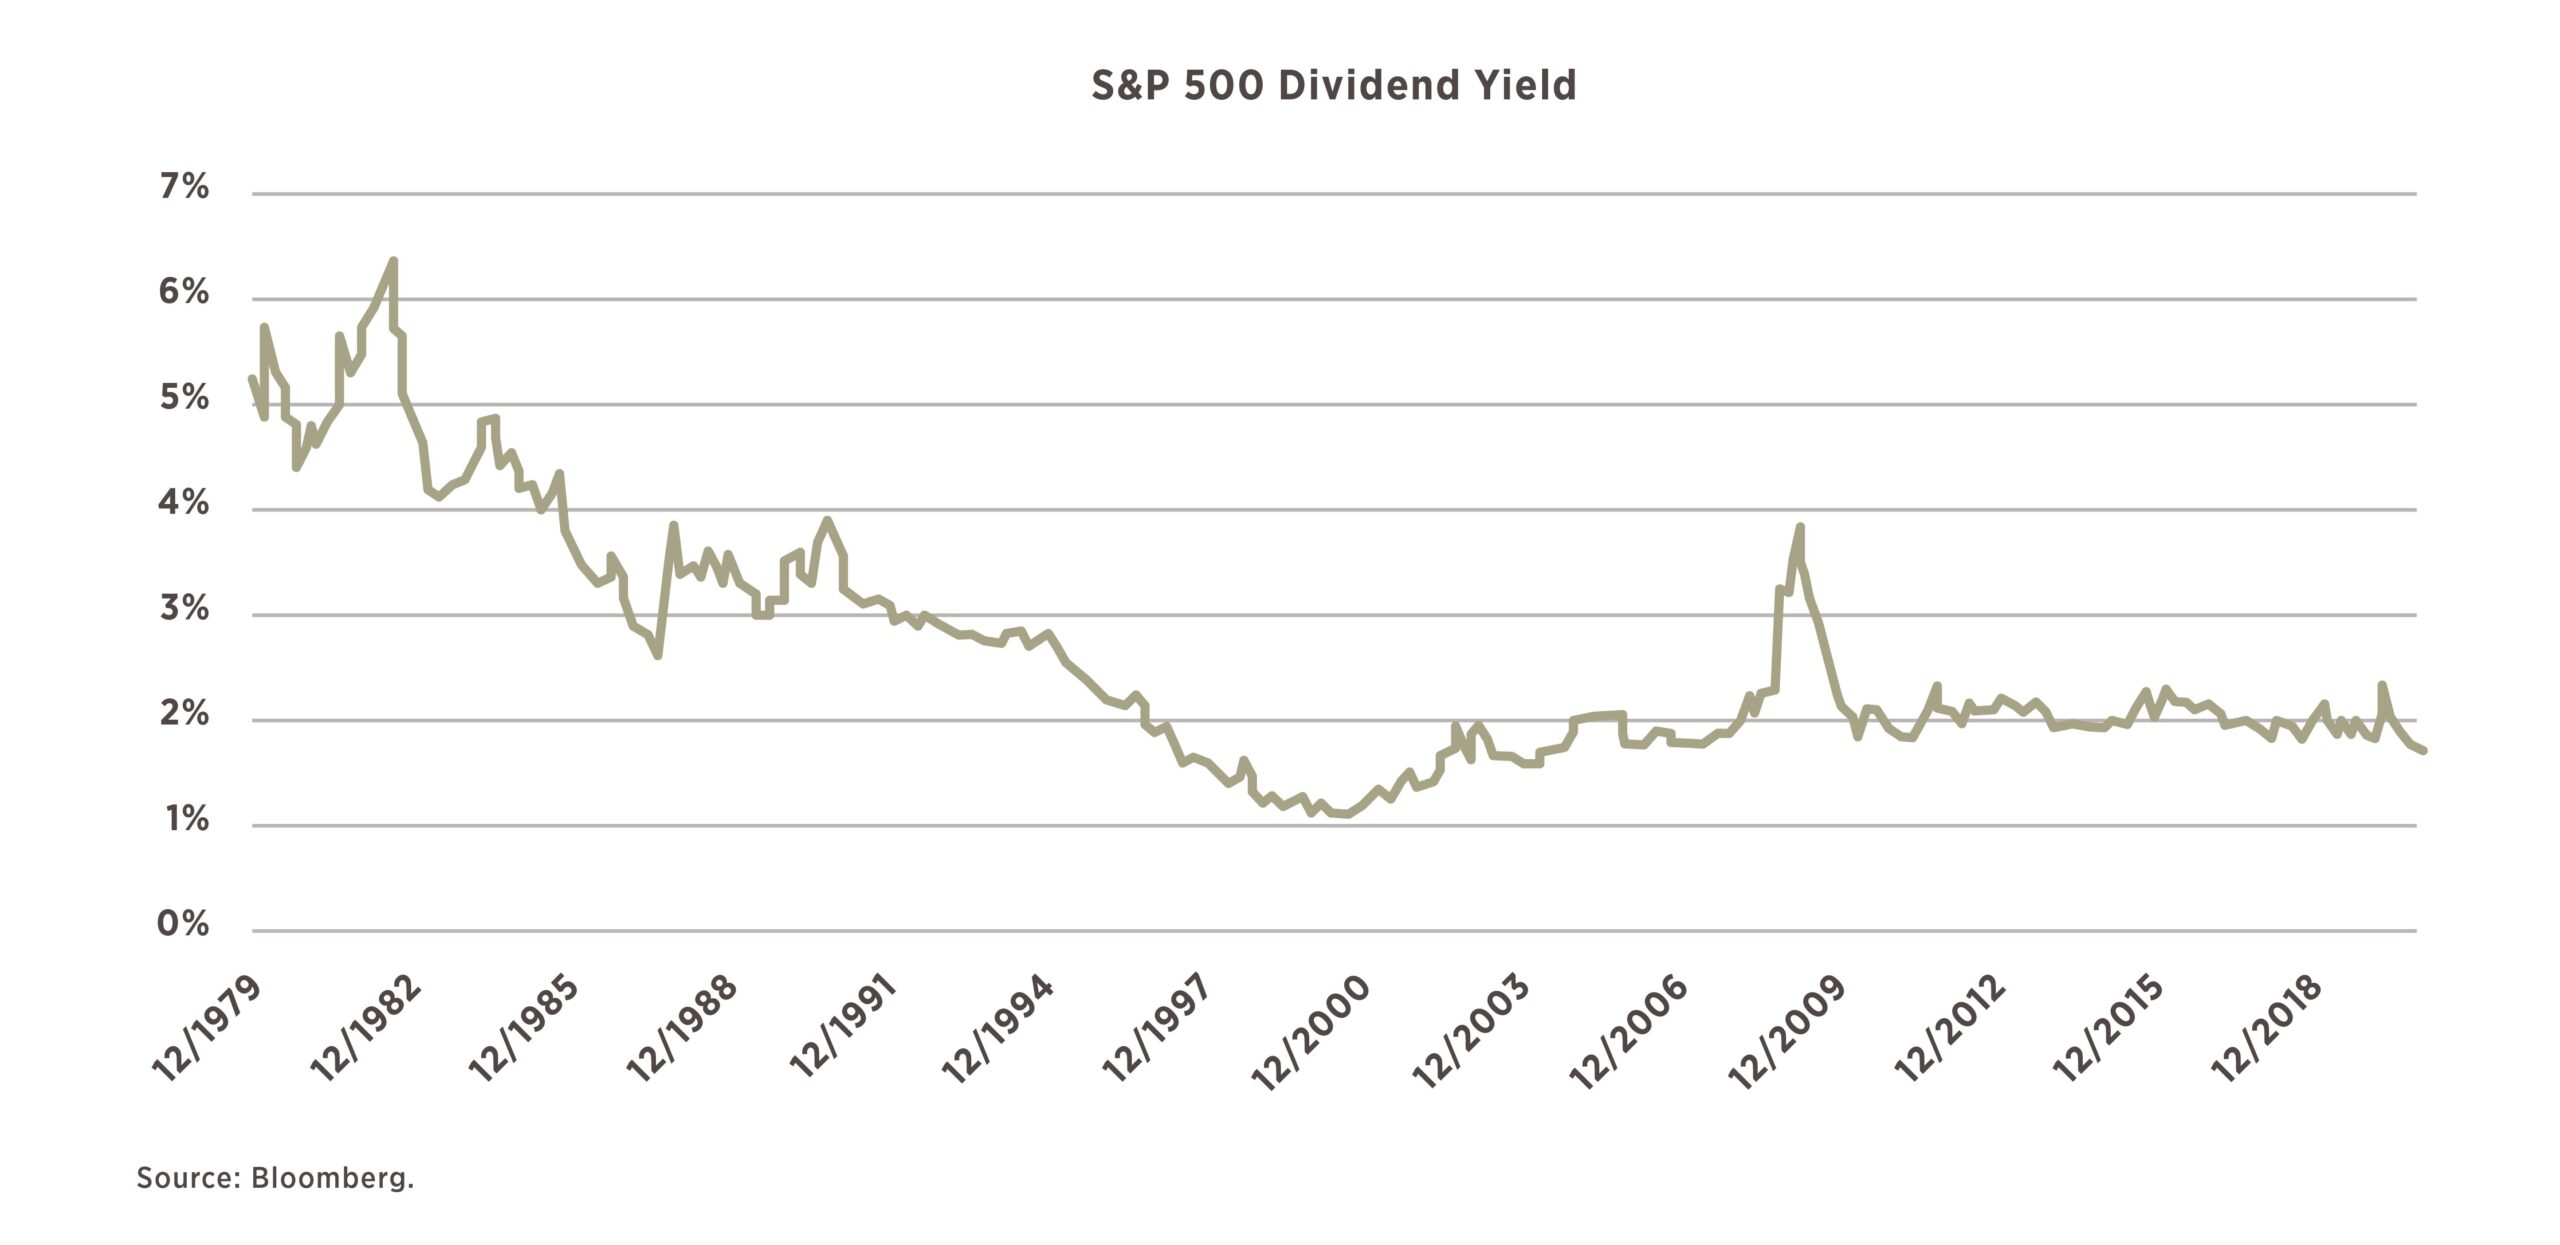
The chart above shows the dividend yield for the S&P 500 going back to 1980. While an investor’s total realized return from dividends will be approximately the average dividend yield over the investment period, the starting dividend yield is a reasonably good estimator of the return we can expect from dividends over the medium-term.1 Currently the S&P 500 has a dividend yield of 1.7%, which we will use as our first building block to forecast future returns. By comparison, in 1980 the dividend yield was much higher at 5.2%. All things being equal (which they never are) stocks in 1980 had higher forward expected returns than today by roughly 3.5% (5.2% – 1.7% = 3.5%).
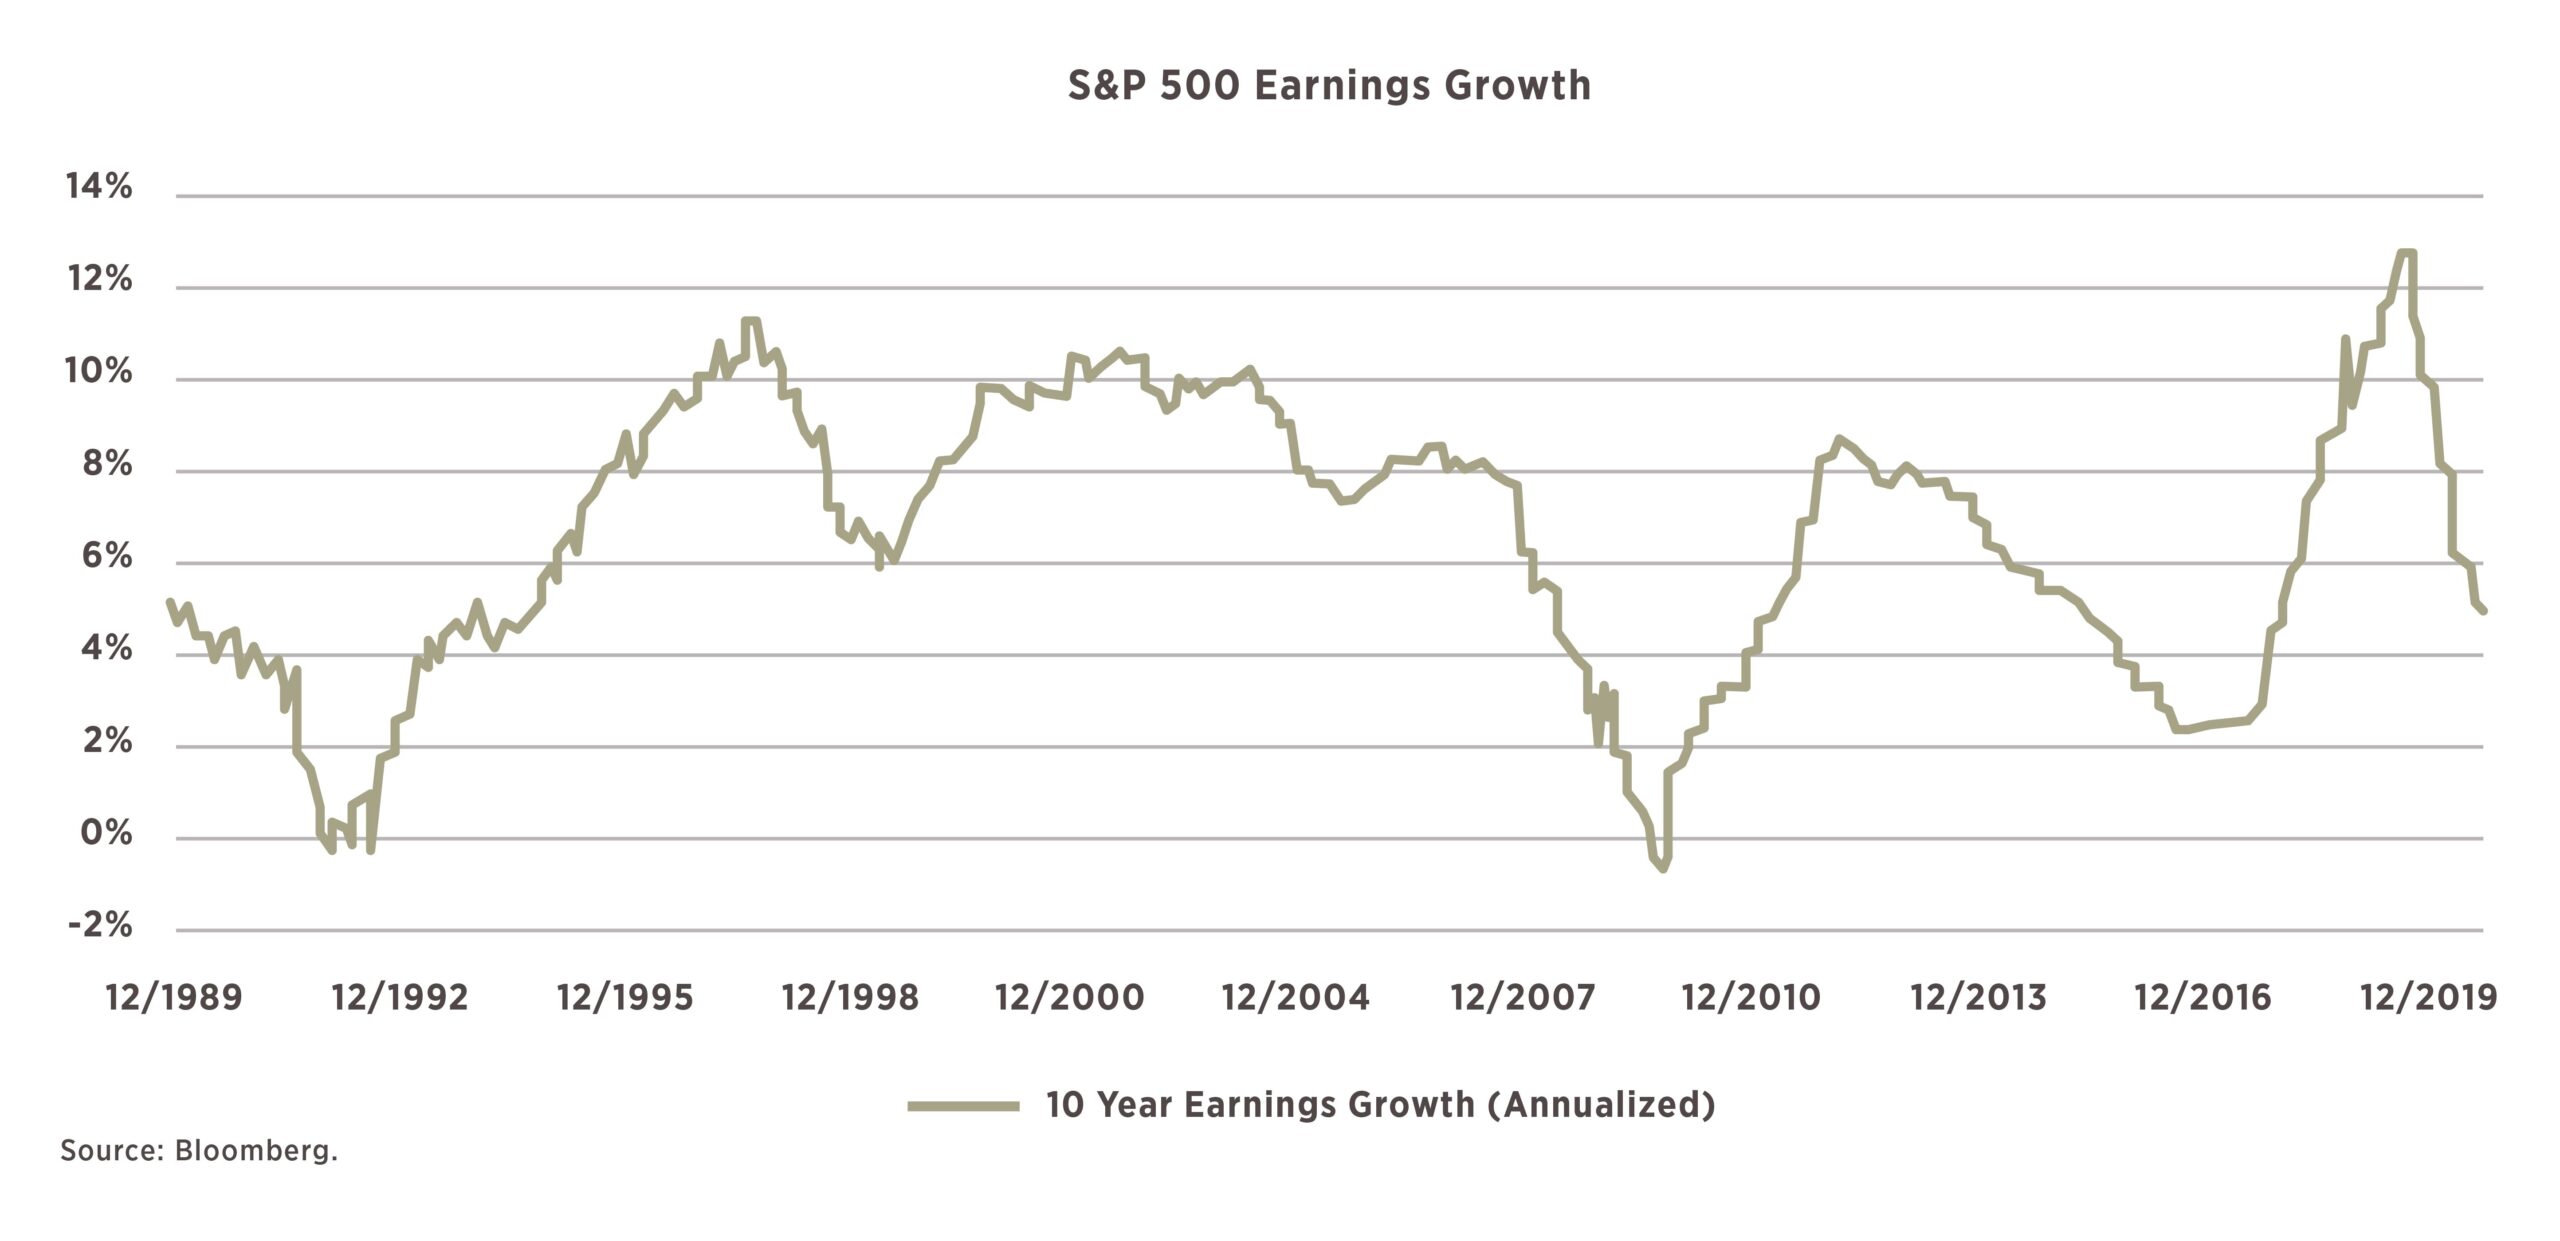
Component #2: Earnings growth
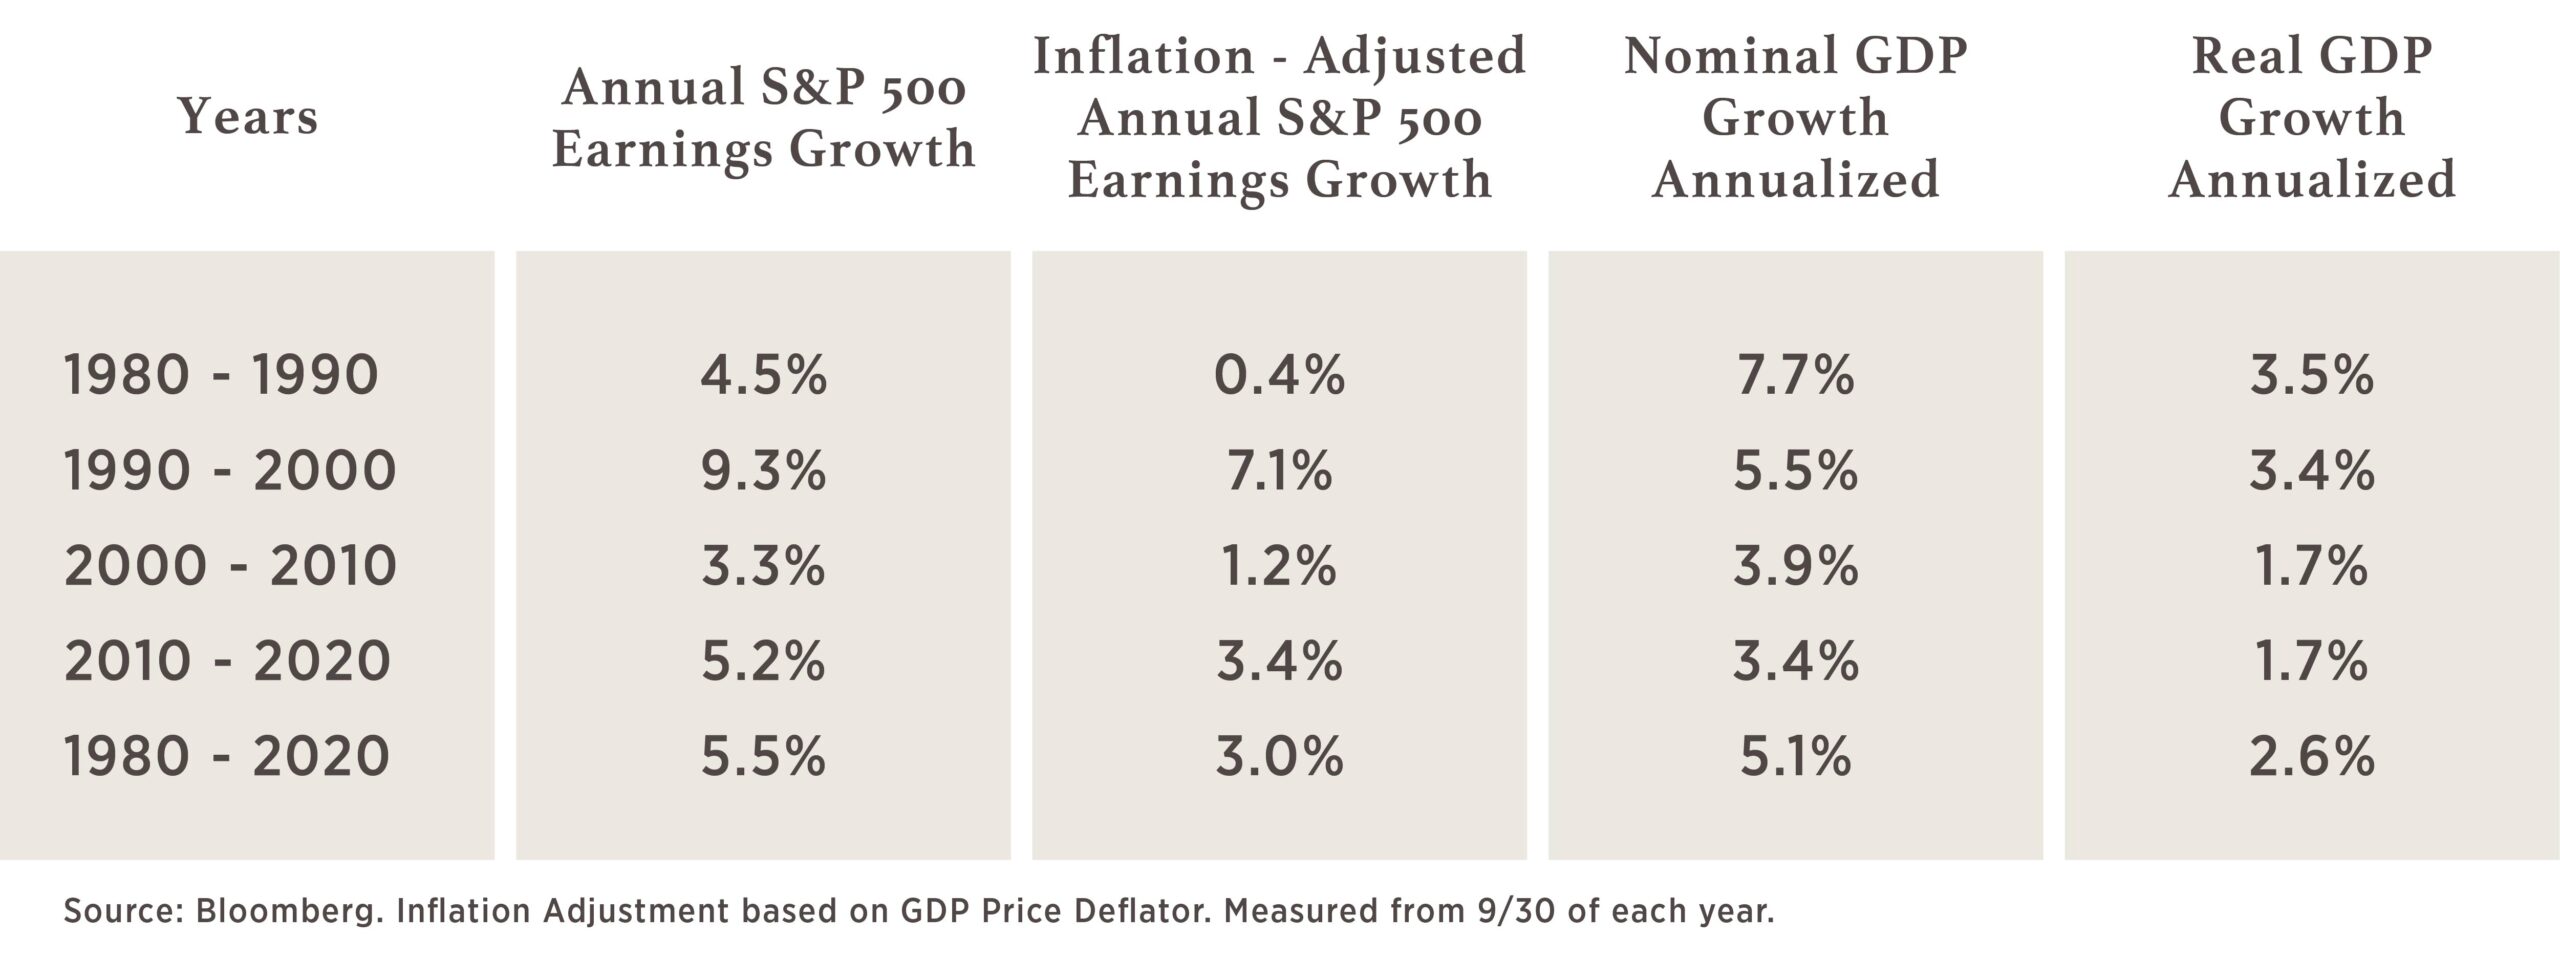
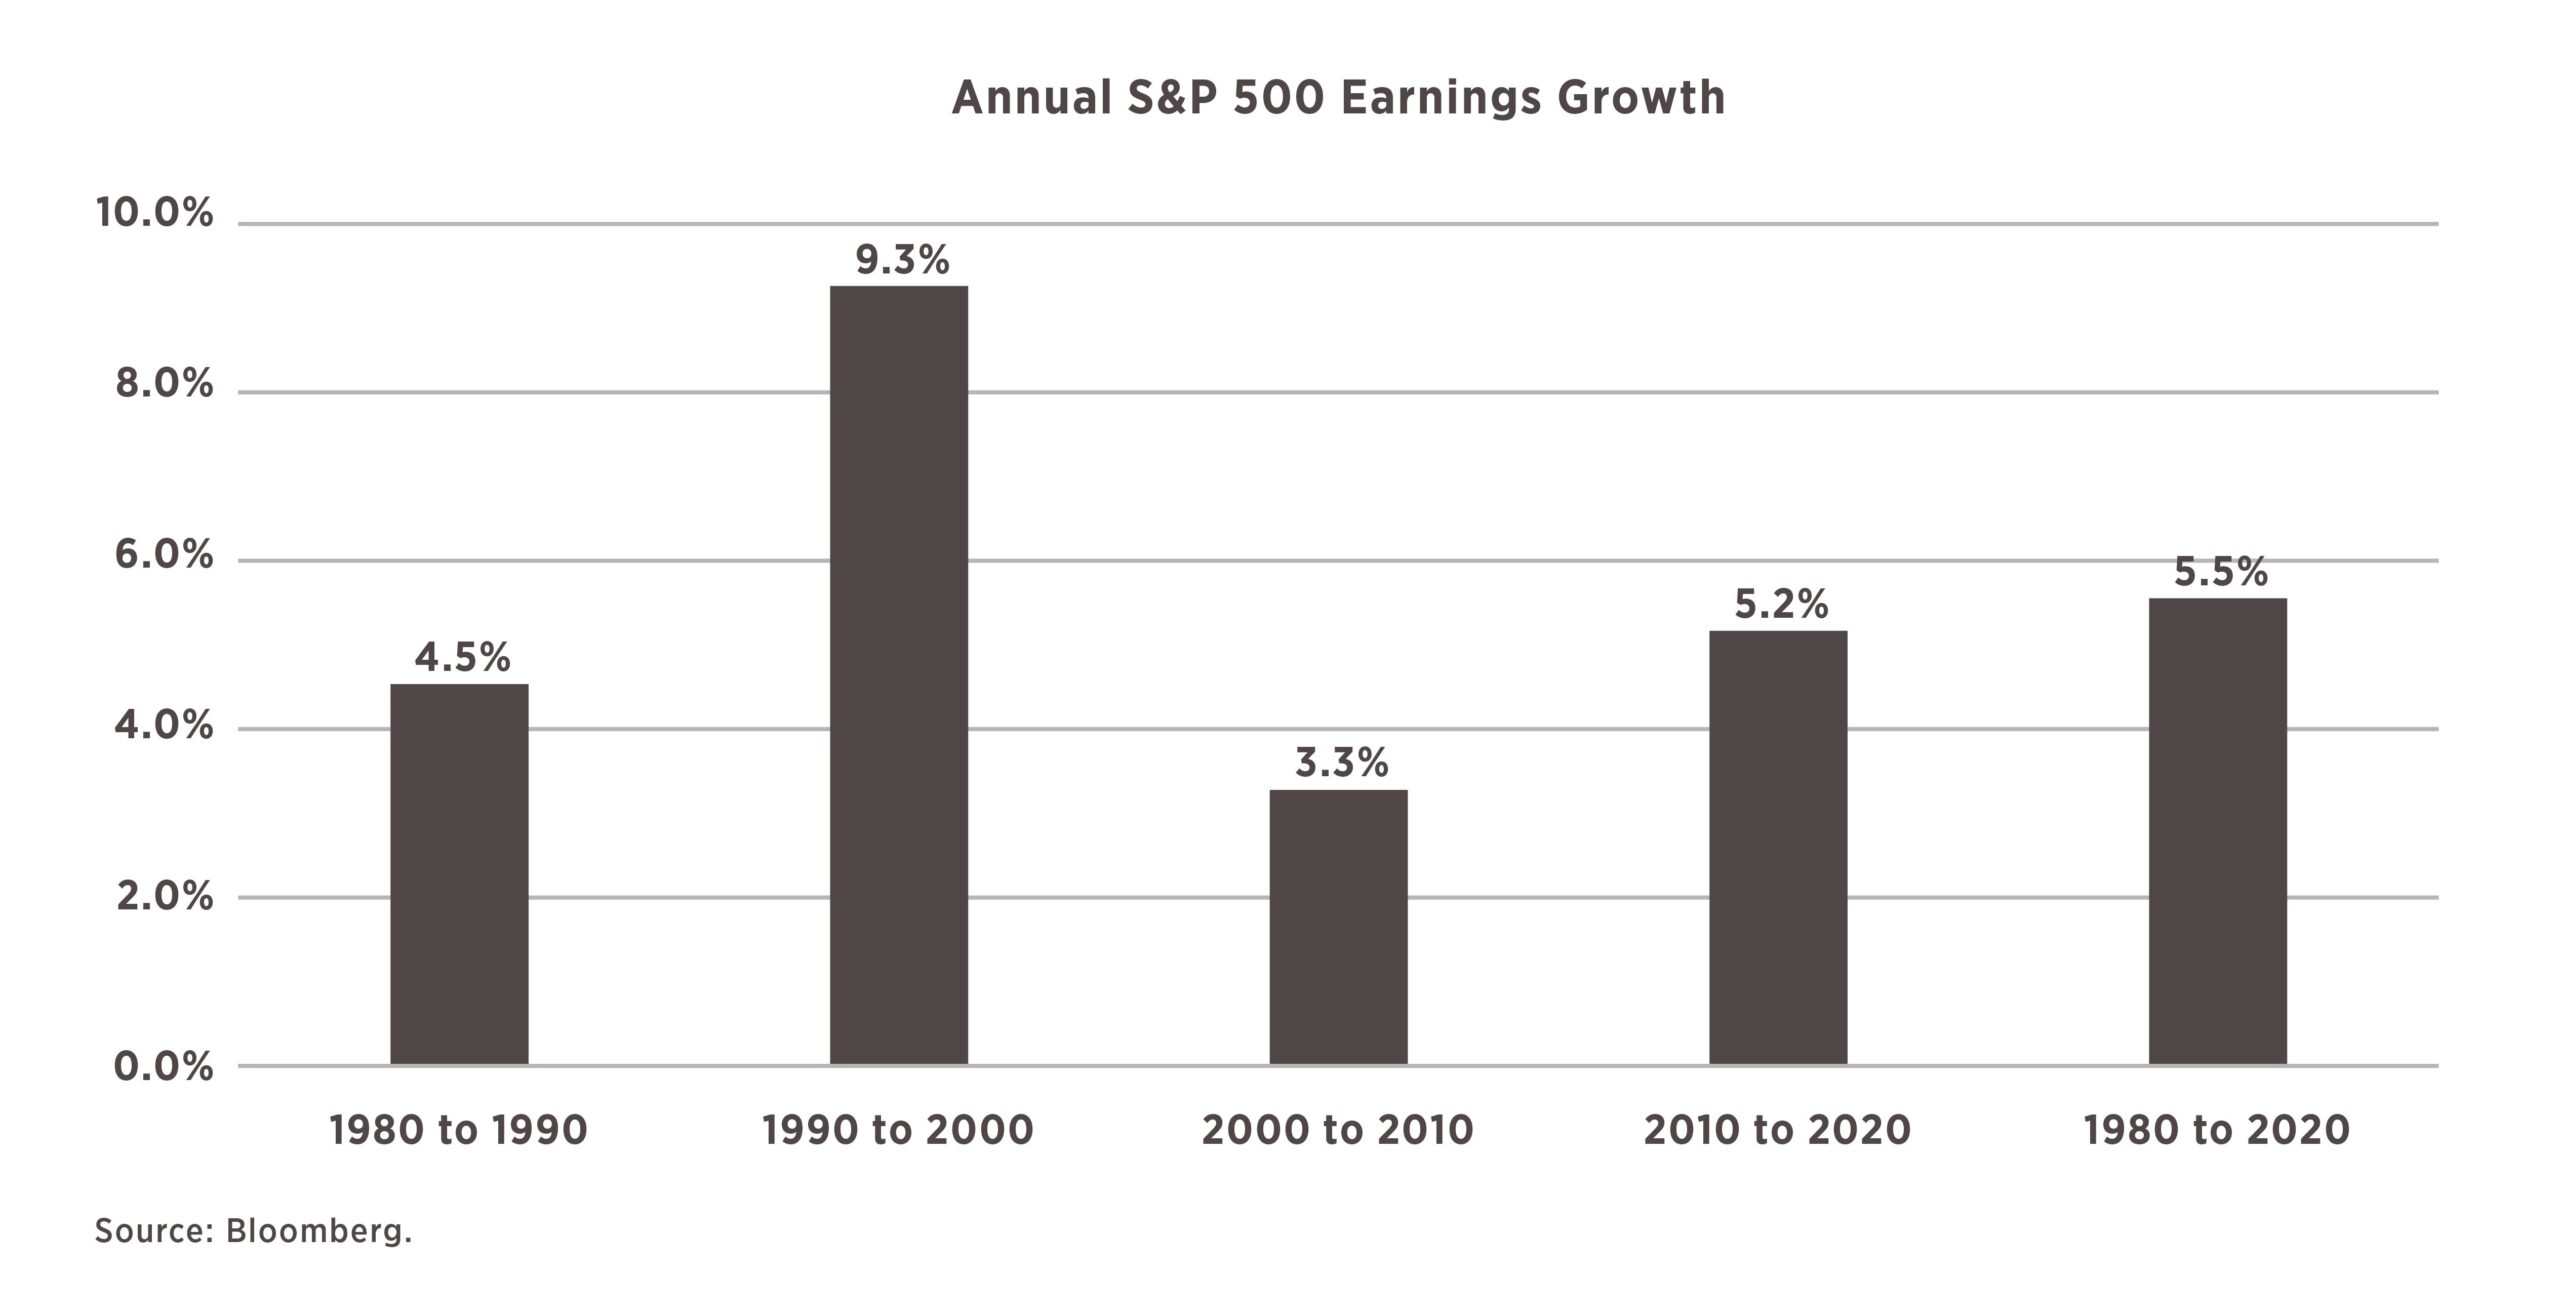
The second component to forecasting long-term returns for stocks is to estimate the forward long-term earnings growth rate. Over the past 40 years, S&P 500 nominal earnings have grown by a compound annual rate of 5.5% / year and real (after inflation) earnings have grown by 3.0%. Over the same period, nominal GDP has grown by 5.1% / year and real GDP has grown by 2.6% / year.
Given the close relationship between earnings growth and GDP growth over longer time periods, we believe it is reasonable to assume earnings growth will continue to track nominal GDP growth. Forecasting longer-term nominal GDP growth has some similarities to forecasting long-term equity returns. We break it down into its principal components: (i) growth in workers; (ii) growth in real output / worker; (iii) inflation. Perhaps in a future blog post we will get into the details surrounding our assumptions on each of these three but for now we will just give you our outlook for them:
- (i) Growth in workers: 1.4% (consistent with past 10 years but above ’00-‘09)
- (ii) Growth in productivity: 1.0% (slightly better than past 10 years but below ’00-’09)
- (iii) Inflation: 2.0%
The result is a forward nominal GDP growth rate of 4.4%. This is below the average nominal GDP growth rate for the previous 40 years but results in a real growth rate of 2.4%, which is consistent with the previous 40 years.
Historically, S&P 500 earnings have grown slightly faster than nominal GDP and we assume that continues going forward. The result is our expectation for forward earnings growth of 4.8%, or 4.4% from GDP growth plus 0.4% to match the historical rate by which S&P earnings growth has outpaced economic growth.
Component #3: Terminal P/E multiple
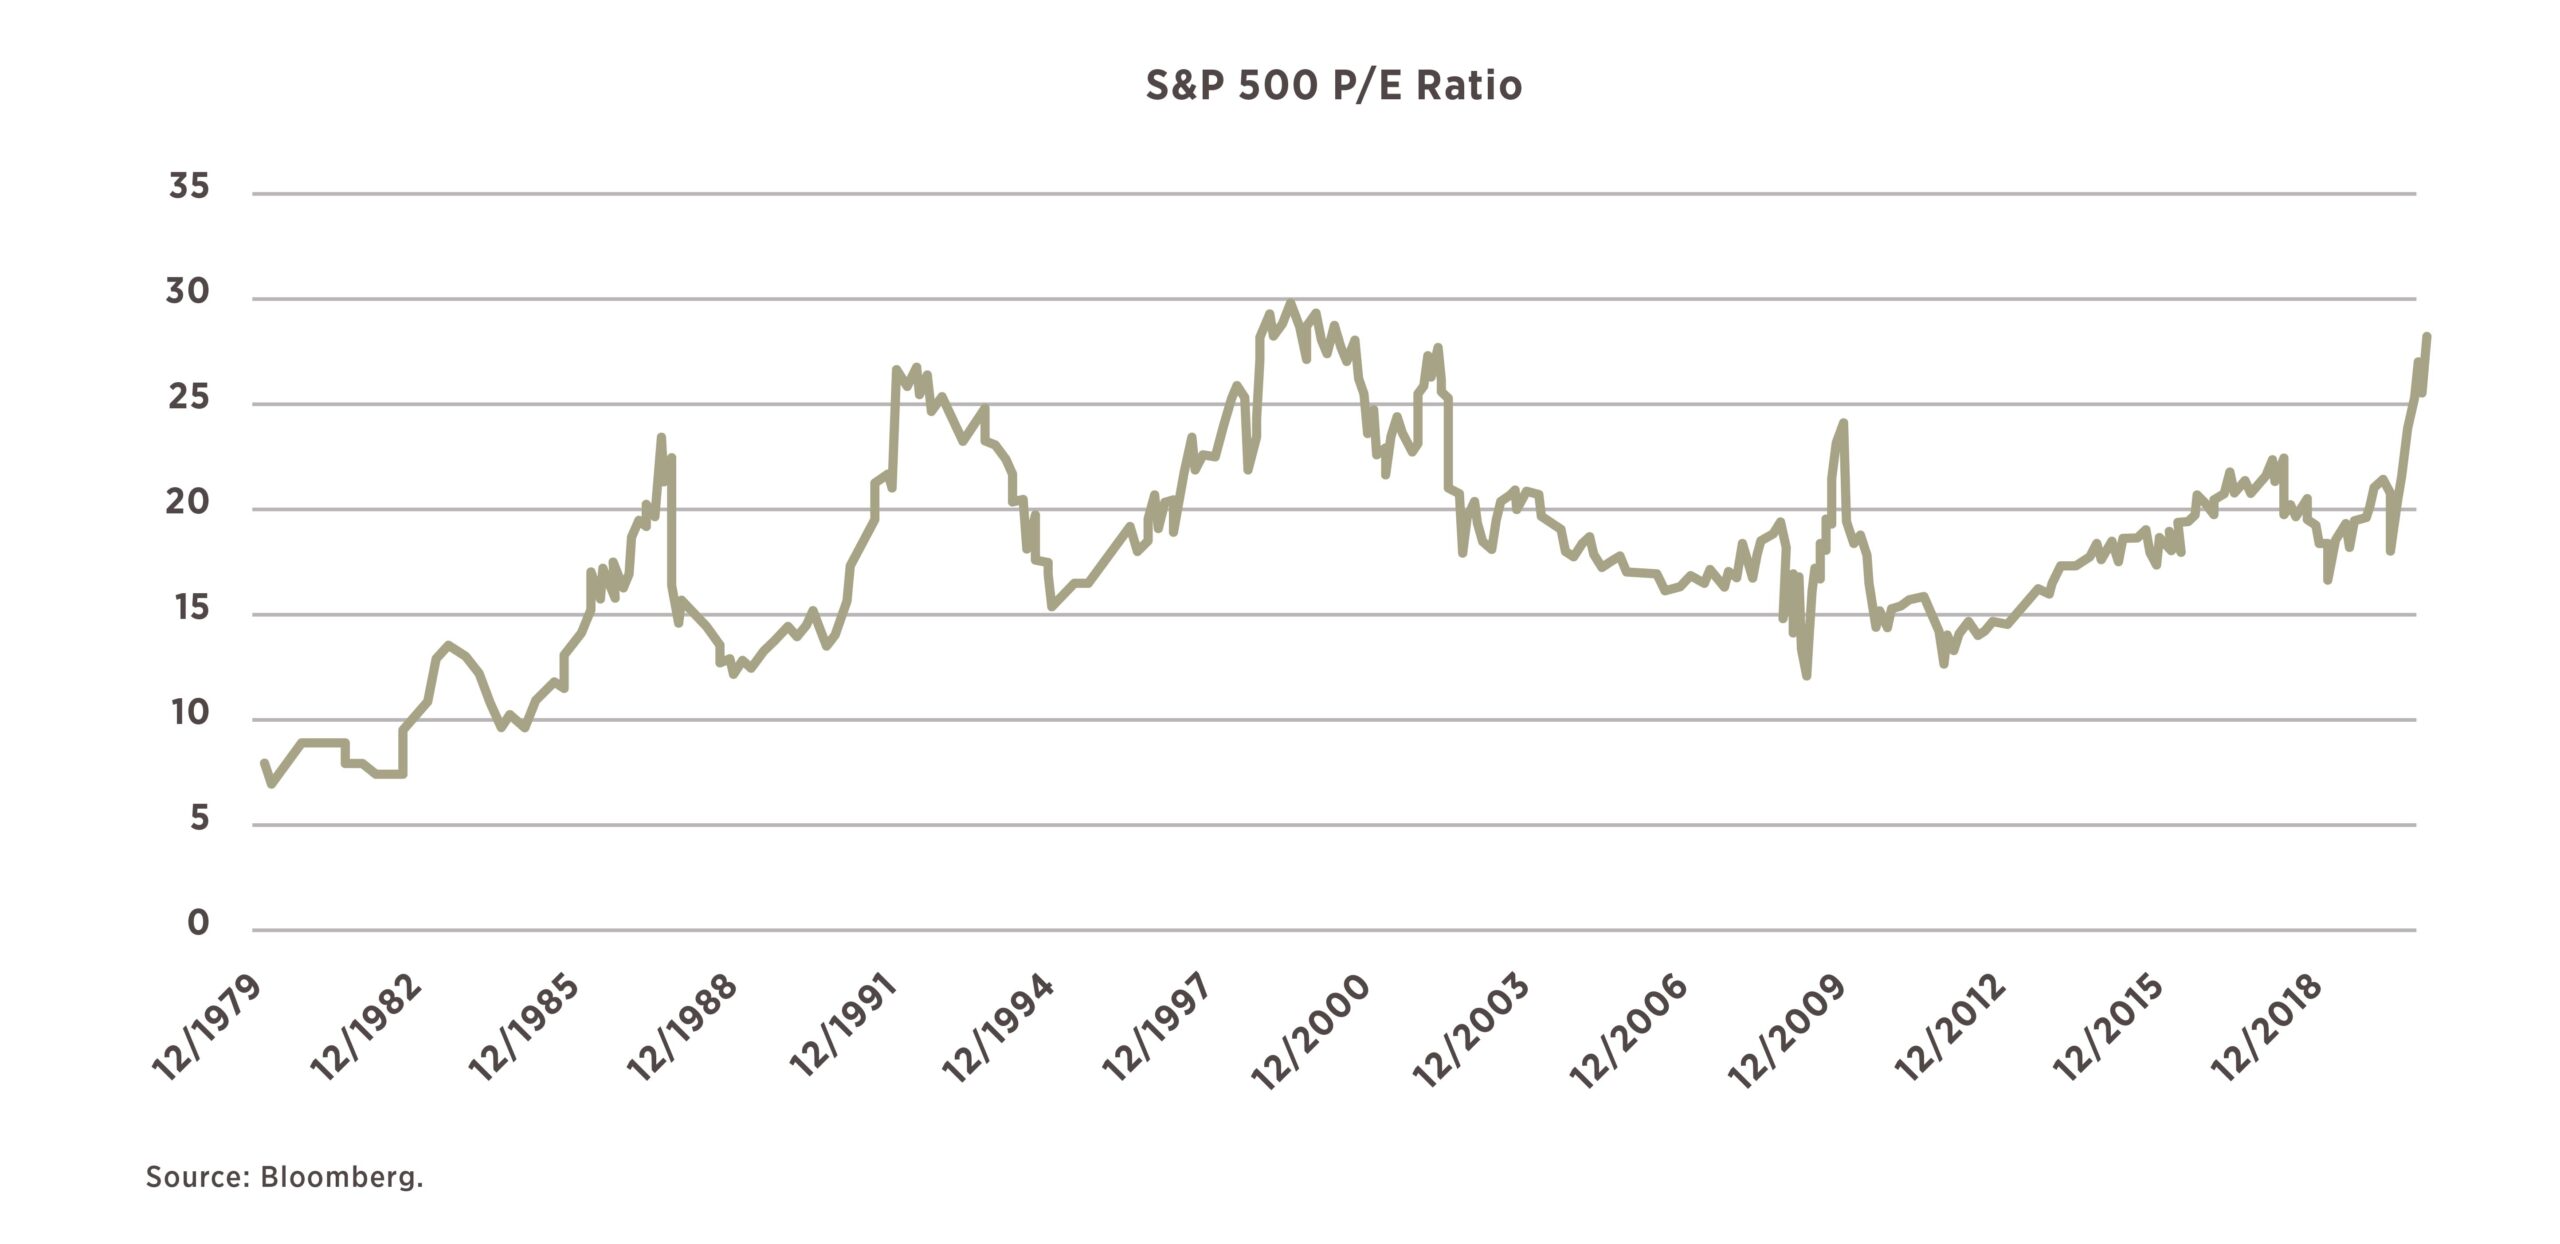
The chart above shows the trailing Price-to-Earnings (P/E) ratio for the S&P 500 over the past 40 years. The P/E ratio is a simple method for describing the stock market’s valuation, or how “expensive” stocks are currently, relative to their earnings. As you can see, the ratio is not stable, but it has averaged approximately 18x over the very long term. Within this time period, the P/E started 1980 at 7.4x, moved all the way up to 30x in the late 1990s, and had recently settled in around 20x. Over the past 12 months, it has exploded higher to over 28x. The difference over the past 40 years is clear: the P/E ratio ended at a significantly higher level than it began, meaning that investors today are willing to pay more for each dollar of earnings. Explanations for the change in valuation level range from the vast decline in interest rates over the past 40 years to the changing composition of the stock market towards companies that are less cyclical and more highly valued.
The actual reason why P/E multiples have quadrupled in the past 40 years is unknown, but we do know that it had a large contribution to the returns investors earned. The question for investors is whether the trend continues, reverts to some lower level, or stays at the current levels. We believe it is unlikely P/E multiples will increase to the same extent going forward. However, they would not have to revert fully back to the 40-year average of 18x to provide a headwind to returns going forward – if multiples just stay flat (at levels that have only ever been hit twice before since 1900) then the equity investor is looking at a total return that is simply the dividend yield + earnings growth.
In the chart below, we show the breakdown of returns between earnings growth, change in P/E multiple and dividends for the S&P 500 Index by decade and over the full 40 years.
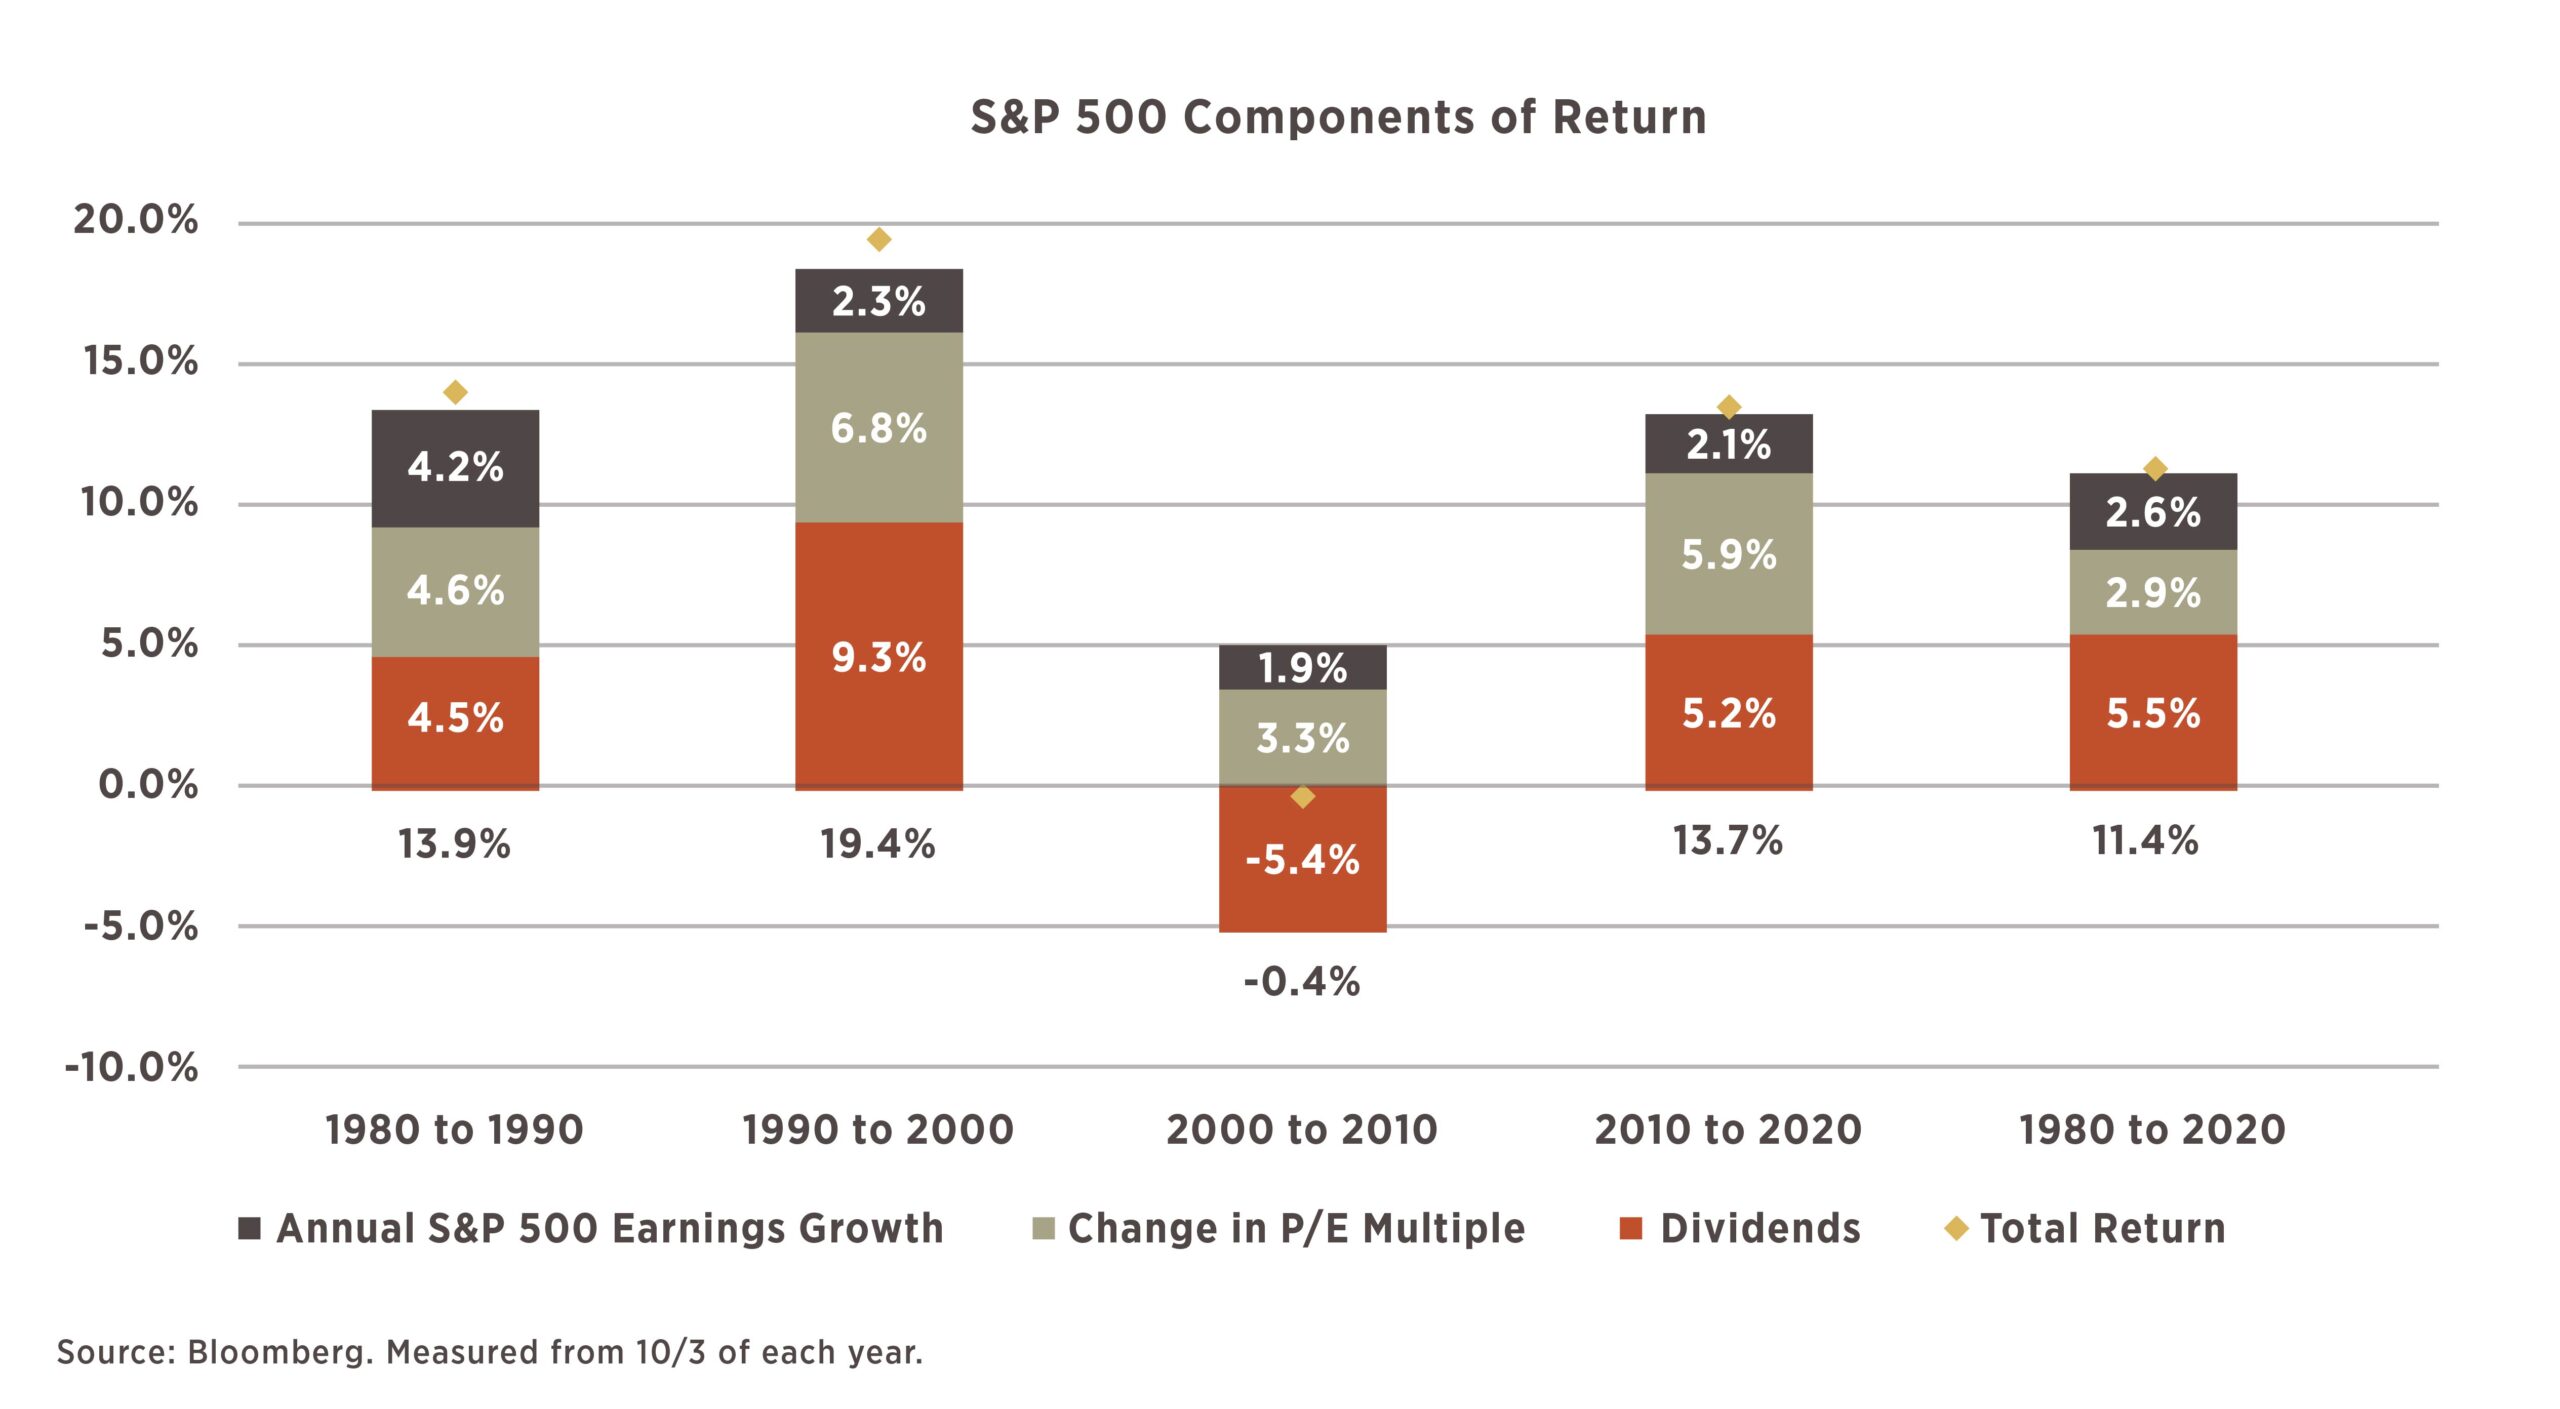
Over the past 40 years, the total return of 11.4% was comprised of 5.5% from real earnings growth, 2.6% from dividends and 2.9% from the expansion of the P/E multiple. Given where we stand today, we believe that assuming additional P/E multiple expansion would be incredibly optimistic. Based on the current dividend yield and our estimate for earnings growth, we arrive at a total return forecast for those two components at 1.7% + 4.8% = 6.5%. Our assumption for a 6% total return from the US stock market going forward includes a modest reduction in the P/E multiple.
How could we get to 11% returns going forward?
To show what would be required to match the 11% return from the past 40 years, we built the matrix below. Across the top we show three different potential earnings growth rates (4%, 5%, 6%) and on the left side we show the ending total return for a stock investor (5%, 7%, 9%, 11%). In the matrix you see the required ending P/E multiple to generate the different levels of return.
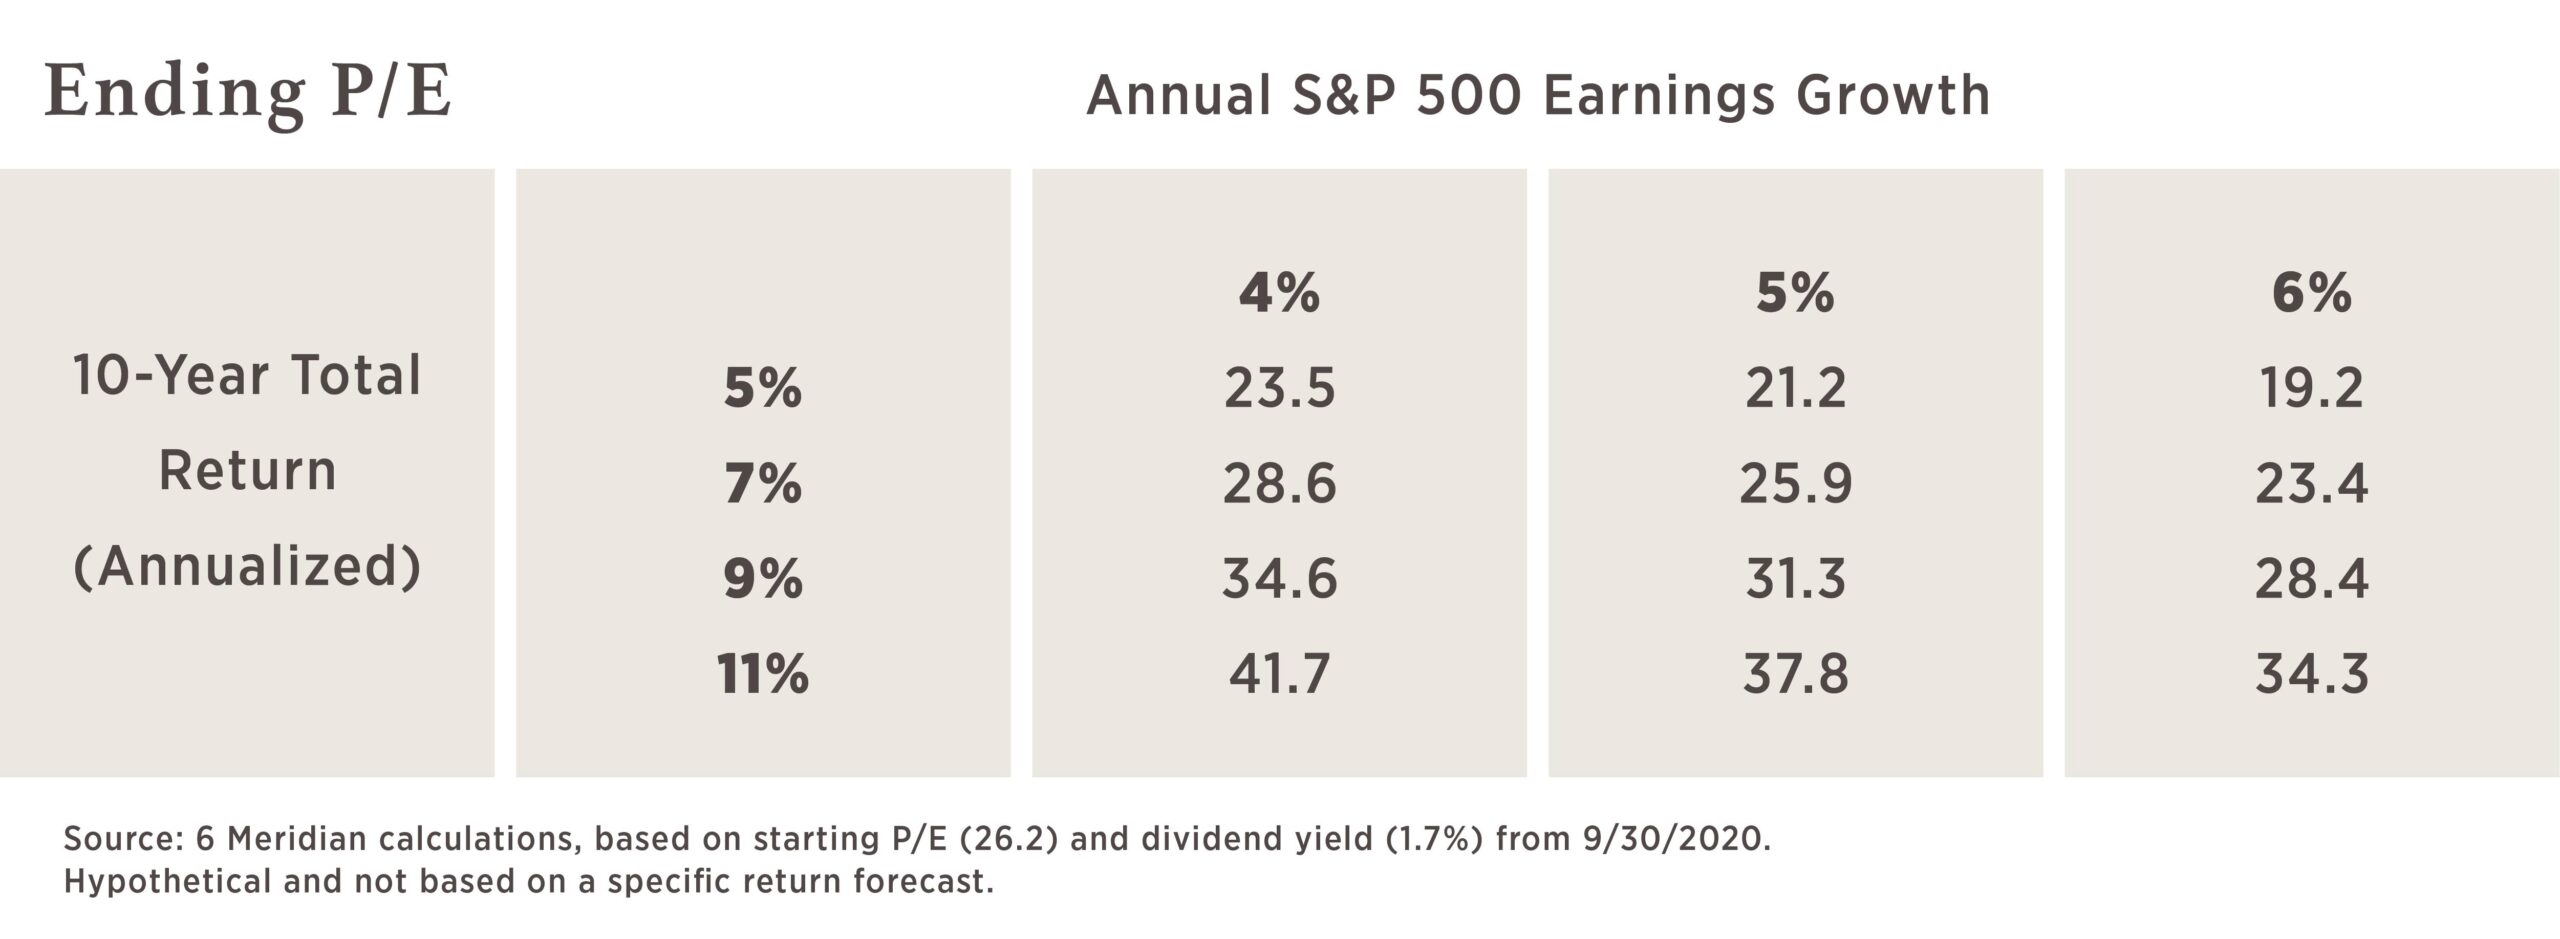
To generate an 11% return would require earnings growth of 6% and a terminal P/E multiple of 34x (which would be the highest in 40 years). While it is certainly not impossible for growth to surprise and the price multiple to continue rising, we think it is highly unlikely for both to happen to that extent. As a result, we keep our base case estimate at 6% forward returns as described above. We realize this is considerably below what investors have earned over the past 40 years, but would note that it is still significantly higher than the expected return available in most other asset classes.
1. It is important to remember that to capture the historical return from the market it required investors to reinvest every dividend payment back into the market.