We have completed another trip around the sun and are embarking on a new year – 2025! With the turn of the calendar, we are often asked, “What do you think will happen in the markets this year?” To which the rational response would be, “We do not know.”
Investing is a long-term exercise; the short-term is too unpredictable and erratic to be forecasted with any accuracy, but nevertheless, Wall Street likes to make predictions and pump out forecasts for the short term.
To see how useful these predictions are, we compiled the forecasts from strategist over the past 25 years to see how well the forecasts did at predicting S&P 500 returns for the year ahead.
Looking back to 2000, the first chart shows the average forecasts tends to be erratic around the actual results. This is not surprising, given how unpredictable short time horizons can be and how “unknowns” can occur throughout the year that spark a dramatic shift in the market.
A clear example of how one event can throw a wrench in what was expected is from 2008, the year of the Great Financial Crisis. Strategists’ average forecast for the S&P 500 in 2008 was a +9.2% return. Ultimately, the S&P 500 ended down 38.5% in 2008, hence the large “overestimation” shown in the graphic. Looking out to 2025, the average strategist price target for the S&P 500 is currently $6,512, an 10.7% rise from year-end 2024 levels (S&P 500 Index = $5,882 @ 12/31/2024).
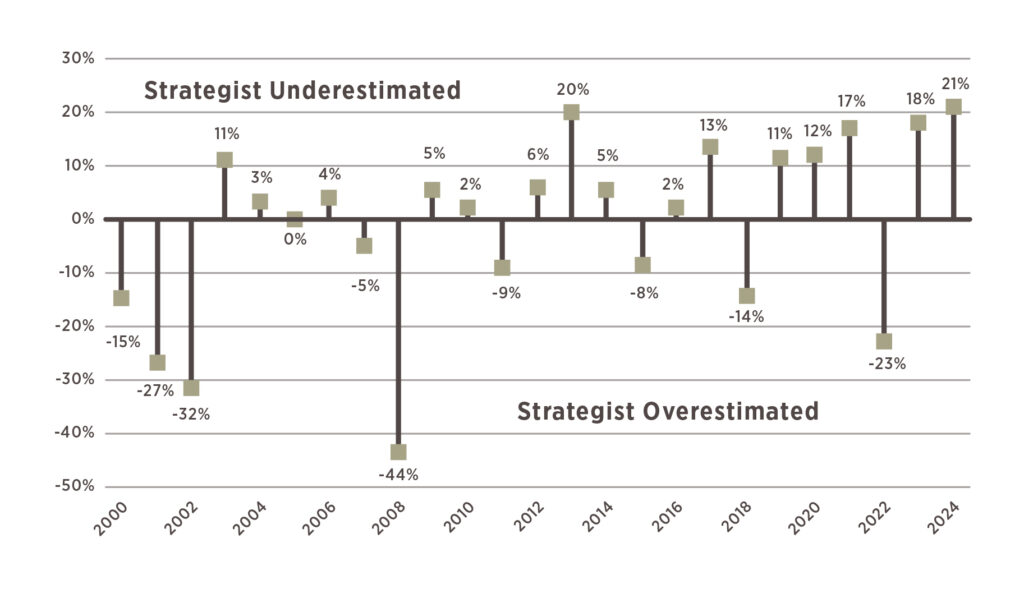
Source: Bloomberg; As of 12/31/2024. Estimates are based off the average strategist projection for the ending S&P 500 price that year (using January average of defined year). The size of the over-or-under-estimation is the actual year-end price vs. the average strategist year-end forecast for the S&P 500.
Another interesting feature of strategists’ S&P 500 price forecasts is that, on average, they don’t predict the market to decline. In the last 25 years, the lowest return forecast was from last December. Strategists expected the S&P 500 to be up only 2% in 2024 vs. its actual price return of +23%. Over the past 25 years, the S&P 500 price change has been negative in 7 of them (28% of the time).
On the flip side, the largest forecasted target increase was in 2001. On average, the expectation was for the S&P to be up 19%. In actuality, the S&P 500 finished down 13% that year. Given that is the largest “forecast” over the last 25 years, it may be surprising to realize that the S&P 500 has had 8 calendar years in which the return has exceeded 19%. This is how you end up with all the sizable “strategist underestimated” results in the first chart!
In the end, strategists tend to keep their one-year forecasts in a relatively tight range. No surprise to anyone, the typical year ahead forecast is for a return of 8.8%, which is very similar to the long-run actual return of the market.
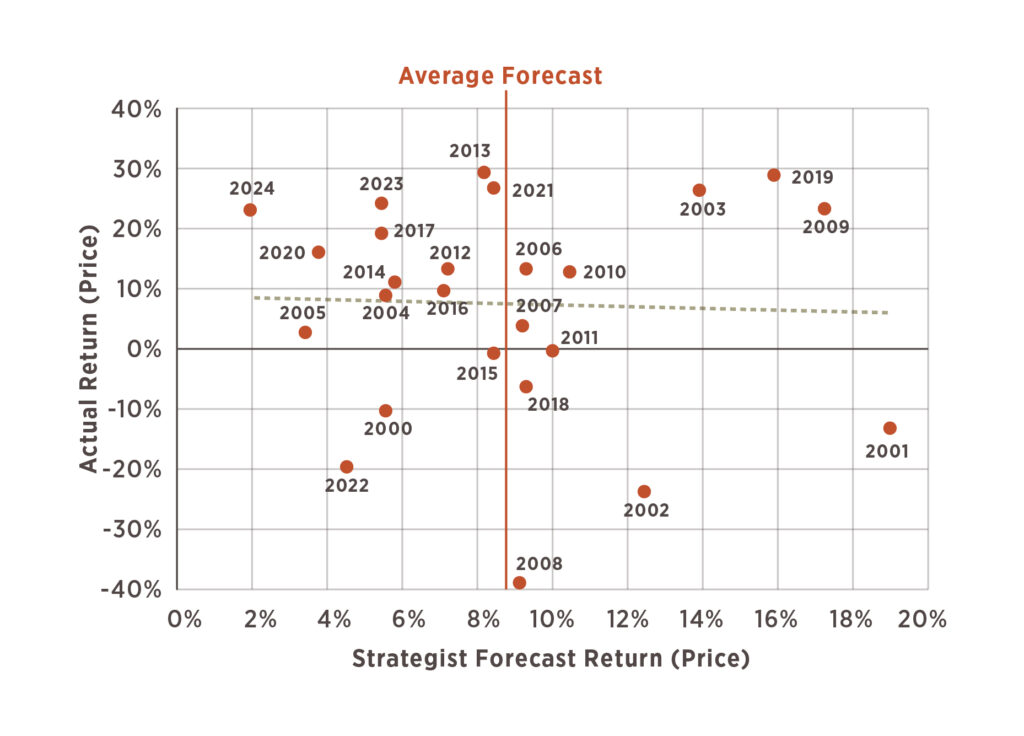
Source: Bloomberg; As of 12/31/2024”. Forecasts are based off the average strategist projection for the ending S&P 500 price that year (using January average of defined year). Actual Returns are based on S&P 500 price changes in the given year.
As the data shows, forecasting the near future is hard. That is why we prefer taking a long-term perspective.
We noted that it probably was not a coincidence that the average strategist price forecast works out to be +8.8% in any year, given the long-run market annual total return since 1928 is +9.8%. This next graphic is a depiction of each calendar year’s total return since the S&P 500’s inception, with the green bar representing the traditionally mentioned long-term return range of 8-10%.
There is no debating the actual returns the S&P 500 has delivered, but what we find most interesting is the fact that there is not one calendar year in which the S&P 500’s total return has actually fallen inside that 8-10% band! This is incredible given 97 years of data, and it speaks to the difficulty of making year-ahead forecasts.
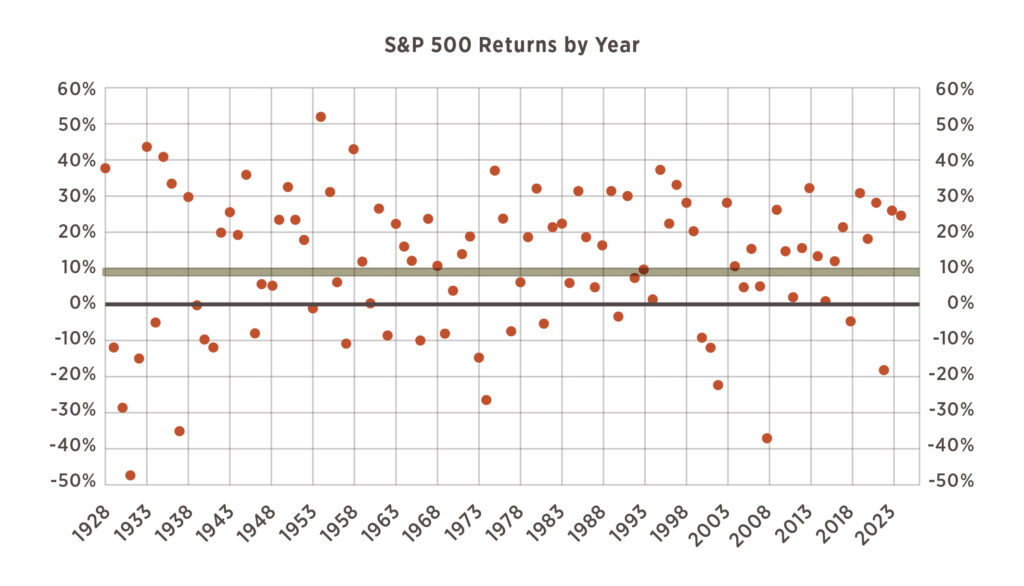
Source: Bloomberg. S&P 500 Index Total Return by Calendar Year with highlight of the 8-10% long-term return band. As of 12/31/2024.
To hammer home the idea of needing a long-term focus, our last graphic is a chart illustrating what 30-year returns have looked like in the S&P 500 since its inception. The “worst” 30-year return a buy-and-hold investor would have had is +6.6% annualized, owning the S&P from 1929-1959 (covers the Great Depression and World War II). An impressive feat alone if anyone reading this had already begun investing in 1929! However, once you get out of that period, 30-year returns fluctuate between +9% and +15% annualized over any given 30-year period starting in 1961.
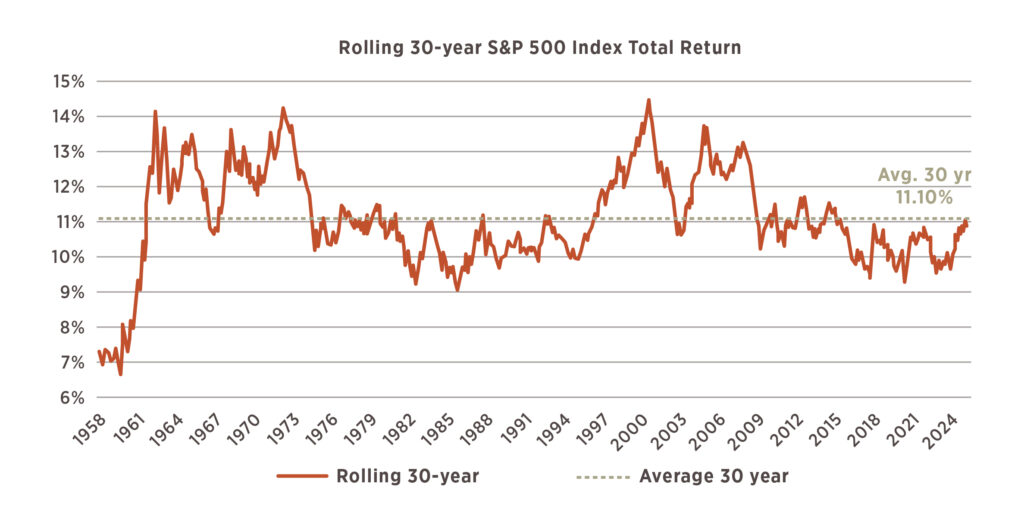
Source: Bloomberg. S&P 500 Index Total Return. Calculated as annualized over a rolling 30-year period. Data from 1928-2024.
The conclusion from all this data is that we ask investors to push away the short-sighted, near-term forecasts flying around in the media and instead focus on how they can position themselves for a better chance of success over the long-term.
As the data showed, short-term forecasts are historically wrong (in both directions), but staying the course in the long-run and avoiding the itch to time the market has historically provided a strong source of generating returns and compounding wealth.


